| Article ID | Journal | Published Year | Pages | File Type |
|---|---|---|---|---|
| 10522995 | Computers & Industrial Engineering | 2005 | 20 Pages |
Abstract
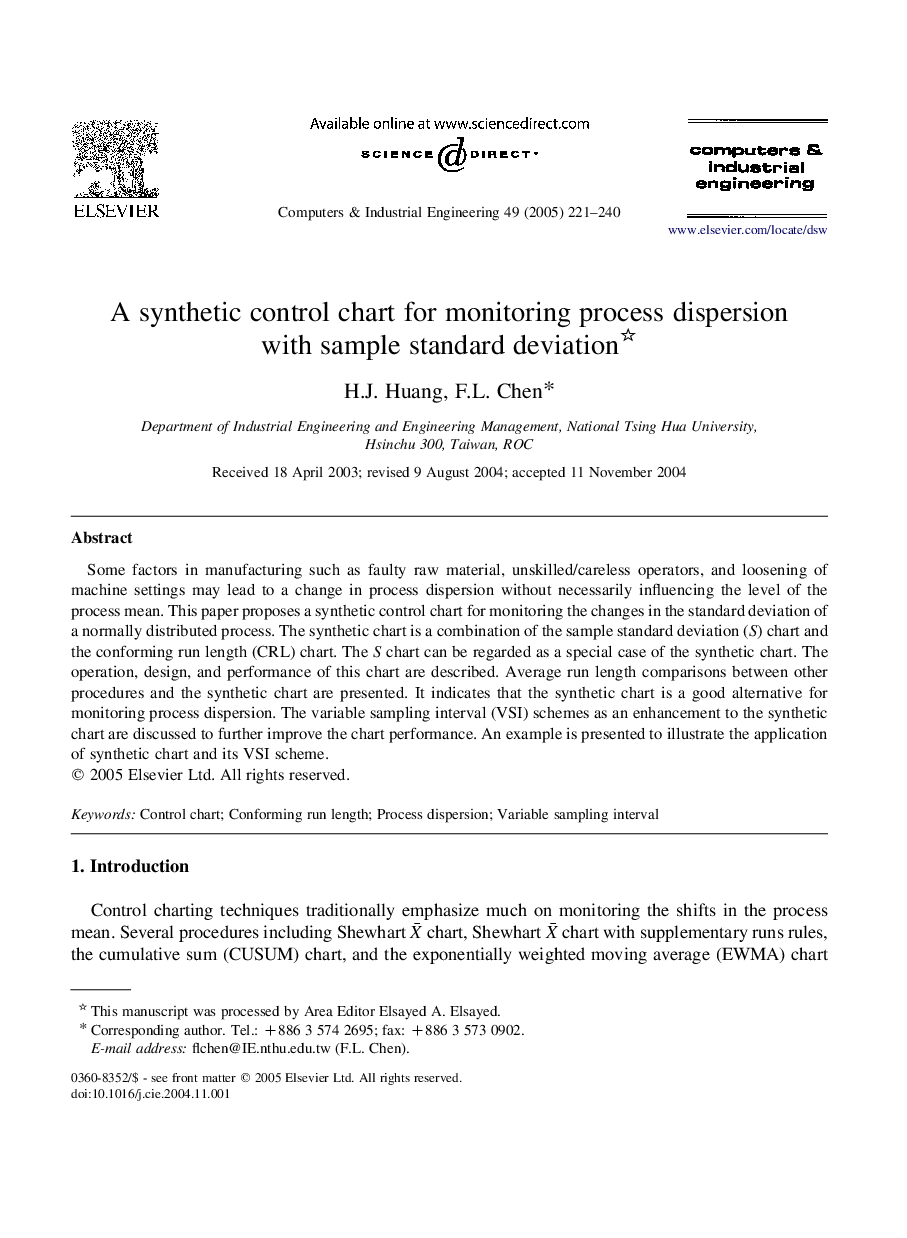
Some factors in manufacturing such as faulty raw material, unskilled/careless operators, and loosening of machine settings may lead to a change in process dispersion without necessarily influencing the level of the process mean. This paper proposes a synthetic control chart for monitoring the changes in the standard deviation of a normally distributed process. The synthetic chart is a combination of the sample standard deviation (S) chart and the conforming run length (CRL) chart. The S chart can be regarded as a special case of the synthetic chart. The operation, design, and performance of this chart are described. Average run length comparisons between other procedures and the synthetic chart are presented. It indicates that the synthetic chart is a good alternative for monitoring process dispersion. The variable sampling interval (VSI) schemes as an enhancement to the synthetic chart are discussed to further improve the chart performance. An example is presented to illustrate the application of synthetic chart and its VSI scheme.
Related Topics
Physical Sciences and Engineering
Engineering
Industrial and Manufacturing Engineering
Authors
H.J. Huang, F.L. Chen,
