| Article ID | Journal | Published Year | Pages | File Type |
|---|---|---|---|---|
| 2905124 | Chest | 2007 | 7 Pages |
Abstract
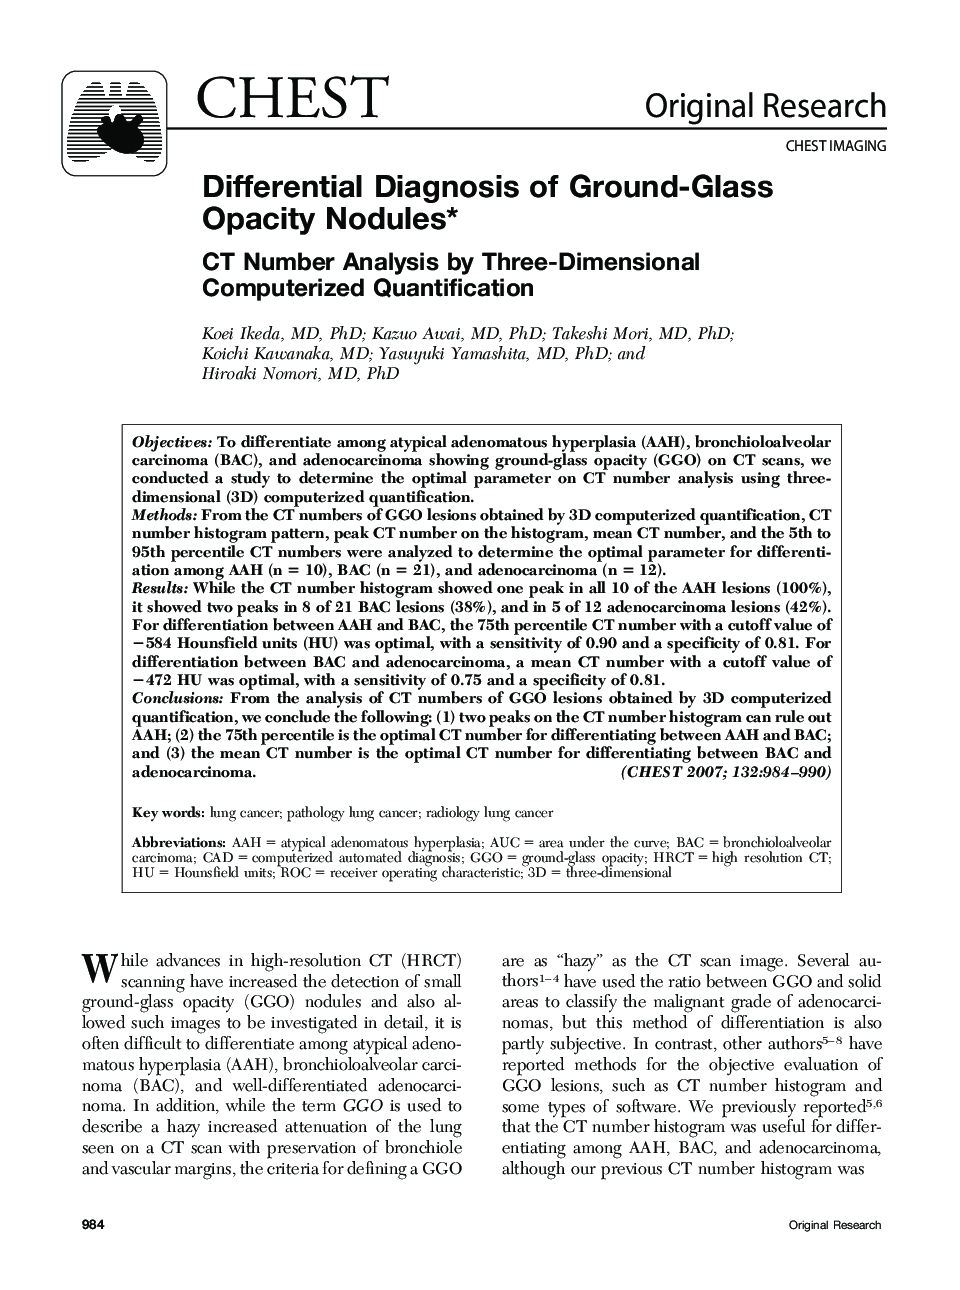
From the analysis of CT numbers of GGO lesions obtained by 3D computerized quantification, we conclude the following: (1) two peaks on the CT number histogram can rule out AAH; (2) the 75th percentile is the optimal CT number for differentiating between AAH and BAC; and (3) the mean CT number is the optimal CT number for differentiating between BAC and adenocarcinoma.
Keywords
Related Topics
Health Sciences
Medicine and Dentistry
Cardiology and Cardiovascular Medicine
Authors
Ikeda MD, PhD, Awai MD, PhD, Mori MD, PhD, Kawanaka MD, Yamashita MD, PhD, Nomori MD, PhD,
