| Article ID | Journal | Published Year | Pages | File Type |
|---|---|---|---|---|
| 4297471 | Journal of Surgical Education | 2015 | 5 Pages |
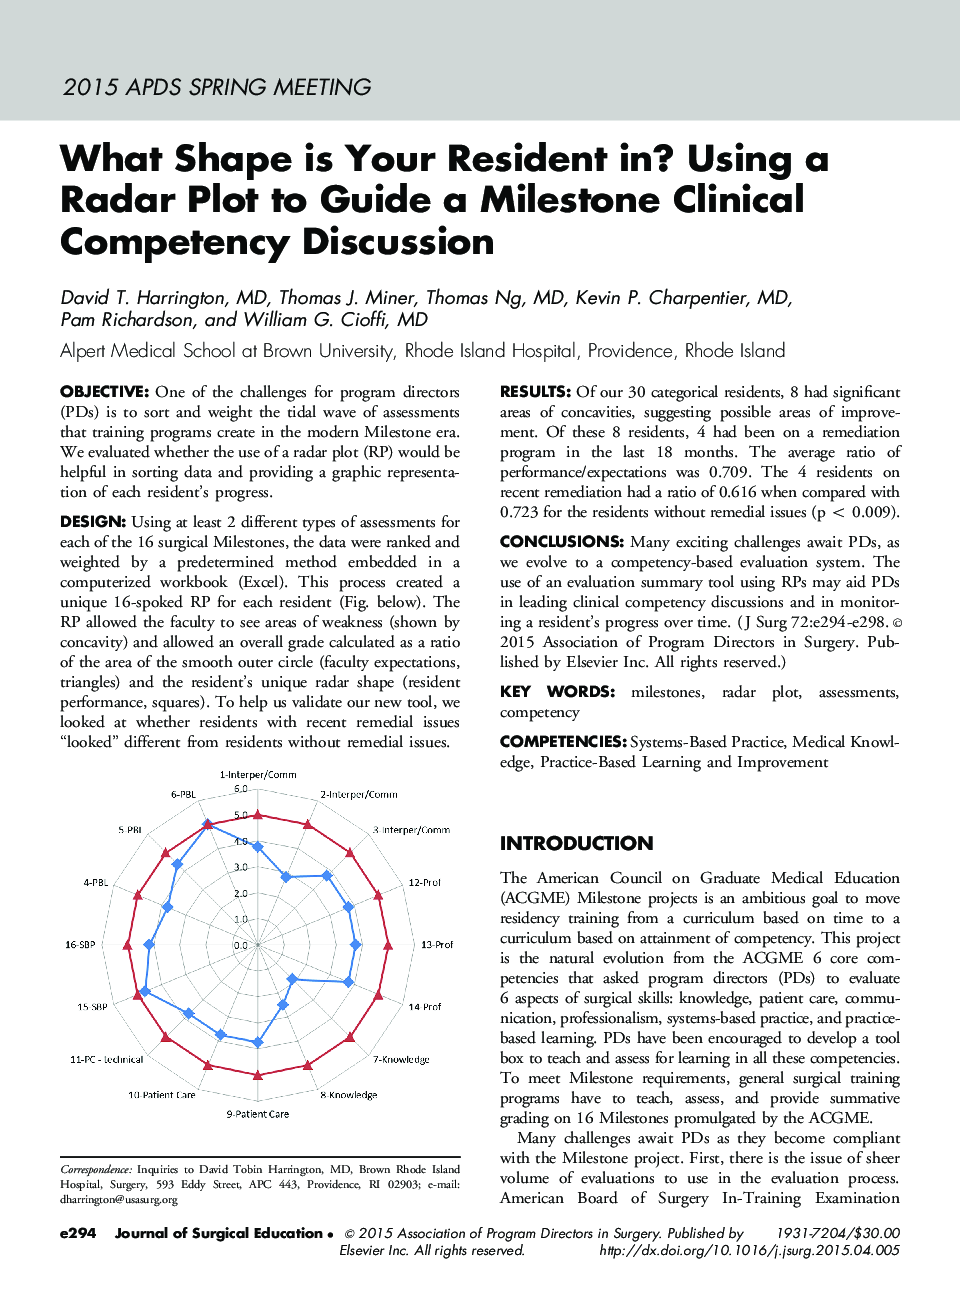
OBJECTIVEOne of the challenges for program directors (PDs) is to sort and weight the tidal wave of assessments that training programs create in the modern Milestone era. We evaluated whether the use of a radar plot (RP) would be helpful in sorting data and providing a graphic representation of each resident’s progress.DESIGNUsing at least 2 different types of assessments for each of the 16 surgical Milestones, the data were ranked and weighted by a predetermined method embedded in a computerized workbook (Excel). This process created a unique 16-spoked RP for each resident (Fig. below). The RP allowed the faculty to see areas of weakness (shown by concavity) and allowed an overall grade calculated as a ratio of the area of the smooth outer circle (faculty expectations, triangles) and the resident’s unique radar shape (resident performance, squares). To help us validate our new tool, we looked at whether residents with recent remedial issues “looked” different from residents without remedial issues.Figure optionsDownload full-size imageDownload high-quality image (273 K)Download as PowerPoint slideRESULTSOf our 30 categorical residents, 8 had significant areas of concavities, suggesting possible areas of improvement. Of these 8 residents, 4 had been on a remediation program in the last 18 months. The average ratio of performance/expectations was 0.709. The 4 residents on recent remediation had a ratio of 0.616 when compared with 0.723 for the residents without remedial issues (p < 0.009).CONCLUSIONSMany exciting challenges await PDs, as we evolve to a competency-based evaluation system. The use of an evaluation summary tool using RPs may aid PDs in leading clinical competency discussions and in monitoring a resident’s progress over time.
