| Article ID | Journal | Published Year | Pages | File Type |
|---|---|---|---|---|
| 4438493 | Atmospheric Environment | 2013 | 8 Pages |
The focus of the paper is application of an inverse-dispersion technique based on a backward Lagrangian stochastic (bLS) model in order to calculate gas-emission rates from industrial complexes. While the bLS technique is attractive for these types of sources, the bLS calculation must assume a spatial configuration for the source. Therefore, results are presented herein of numerical simulations designed to study the sensitivity of emissions calculations to the assumption of source configuration for complex industrial sources. We discuss how measurement fetch, concentration sensor height, and optical path length influence the accuracy of emission estimation. Through simulations, we identify an improved sensor configuration in order to reduce emission-calculation errors caused by an incorrect source-configuration assumption. It is concluded that, with respect to our defined source, the optimal measurement fetch may be between 200 m and 300 m; also, the ideal measurement height is probably between 2.0 m and 2.5 m. With choices within these two ranges, a path length of about 200 m is adequate, and greater path lengths, above 200 m, result in no substantial improvement in emission calculations.
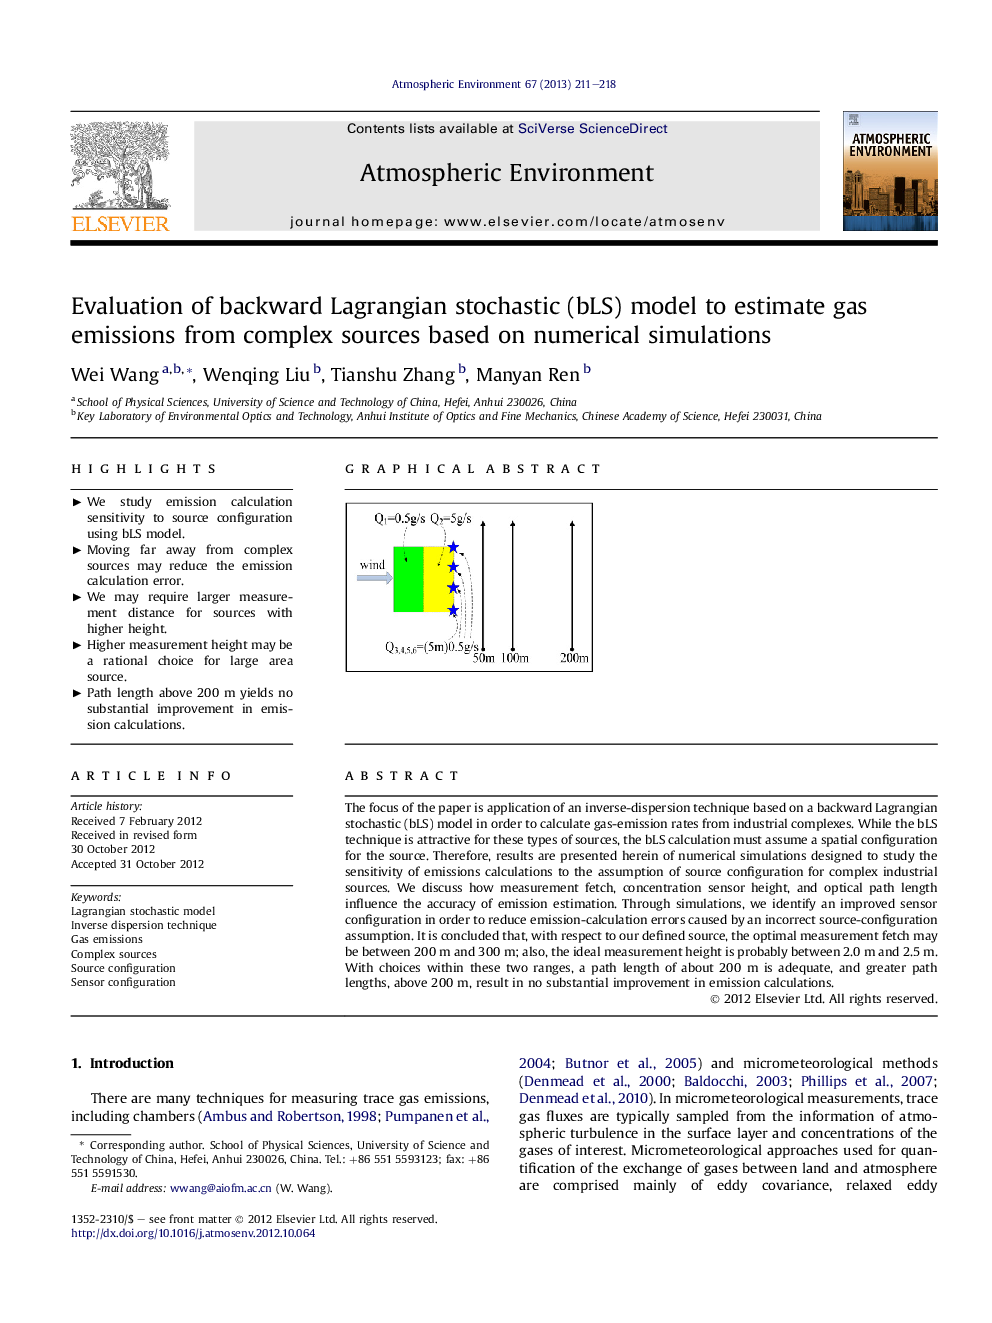
► We study emission calculation sensitivity to source configuration using bLS model. ► Moving far away from complex sources may reduce the emission calculation error. ► We may require larger measurement distance for sources with higher height. ► Higher measurement height may be a rational choice for large area source. ► Path length above 200 m yields no substantial improvement in emission calculations.Graphical abstractIn order to examine the sensitivity of emission calculations based on a bLS model to the assumption of source configuration for industrial complex sources using numerical simulation, we constructed ten source configurations in a hypothetical industrial site, consisting of two area sources and one or more elevated point sources, each emitting tracer at different rates. The above plot is one of the source configurations, and the straight lines with arrows illustrate the positions of line-average concentration sensor. We discuss how measurement fetch, concentration sensor height, and optical path length influence the accuracy of emission estimation.Figure optionsDownload full-size imageDownload high-quality image (90 K)Download as PowerPoint slide
