| Article ID | Journal | Published Year | Pages | File Type |
|---|---|---|---|---|
| 5103217 | Physica A: Statistical Mechanics and its Applications | 2017 | 8 Pages |
Abstract
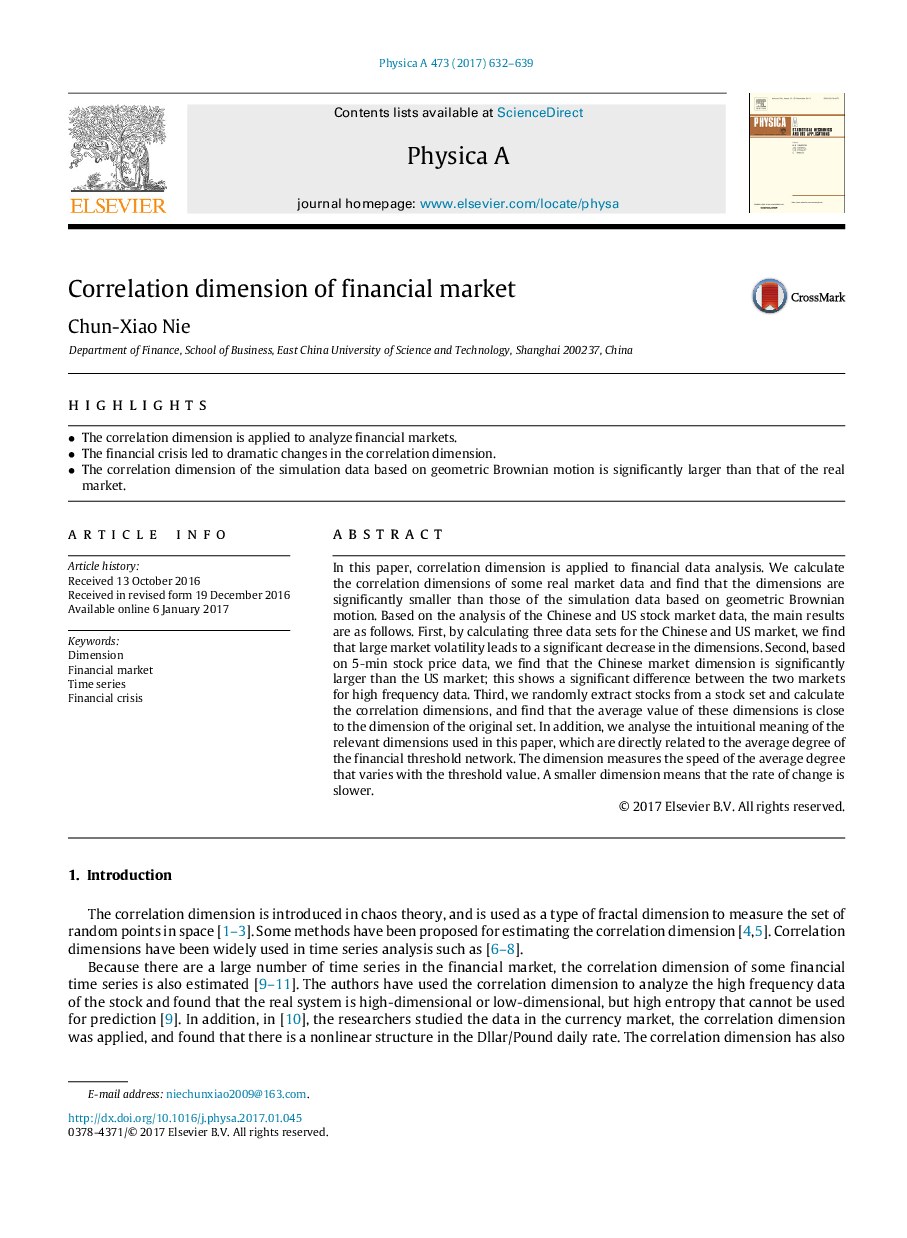
In this paper, correlation dimension is applied to financial data analysis. We calculate the correlation dimensions of some real market data and find that the dimensions are significantly smaller than those of the simulation data based on geometric Brownian motion. Based on the analysis of the Chinese and US stock market data, the main results are as follows. First, by calculating three data sets for the Chinese and US market, we find that large market volatility leads to a significant decrease in the dimensions. Second, based on 5-min stock price data, we find that the Chinese market dimension is significantly larger than the US market; this shows a significant difference between the two markets for high frequency data. Third, we randomly extract stocks from a stock set and calculate the correlation dimensions, and find that the average value of these dimensions is close to the dimension of the original set. In addition, we analyse the intuitional meaning of the relevant dimensions used in this paper, which are directly related to the average degree of the financial threshold network. The dimension measures the speed of the average degree that varies with the threshold value. A smaller dimension means that the rate of change is slower.
Related Topics
Physical Sciences and Engineering
Mathematics
Mathematical Physics
Authors
Chun-Xiao Nie,
