| Article ID | Journal | Published Year | Pages | File Type |
|---|---|---|---|---|
| 5750848 | Science of The Total Environment | 2017 | 9 Pages |
â¢Elevated levels of environmental lead were measured in a smelter community.â¢Biomonitoring of children identified a geometric mean BLL of 1.41 μg/dL.â¢Lead was measured in co-located soil, household dust, tap water, and paint.â¢Soil, dust, paint, and age of home were significantly correlated to BLLs.â¢Variability in BLLs was poorly explained by environmental factors alone.
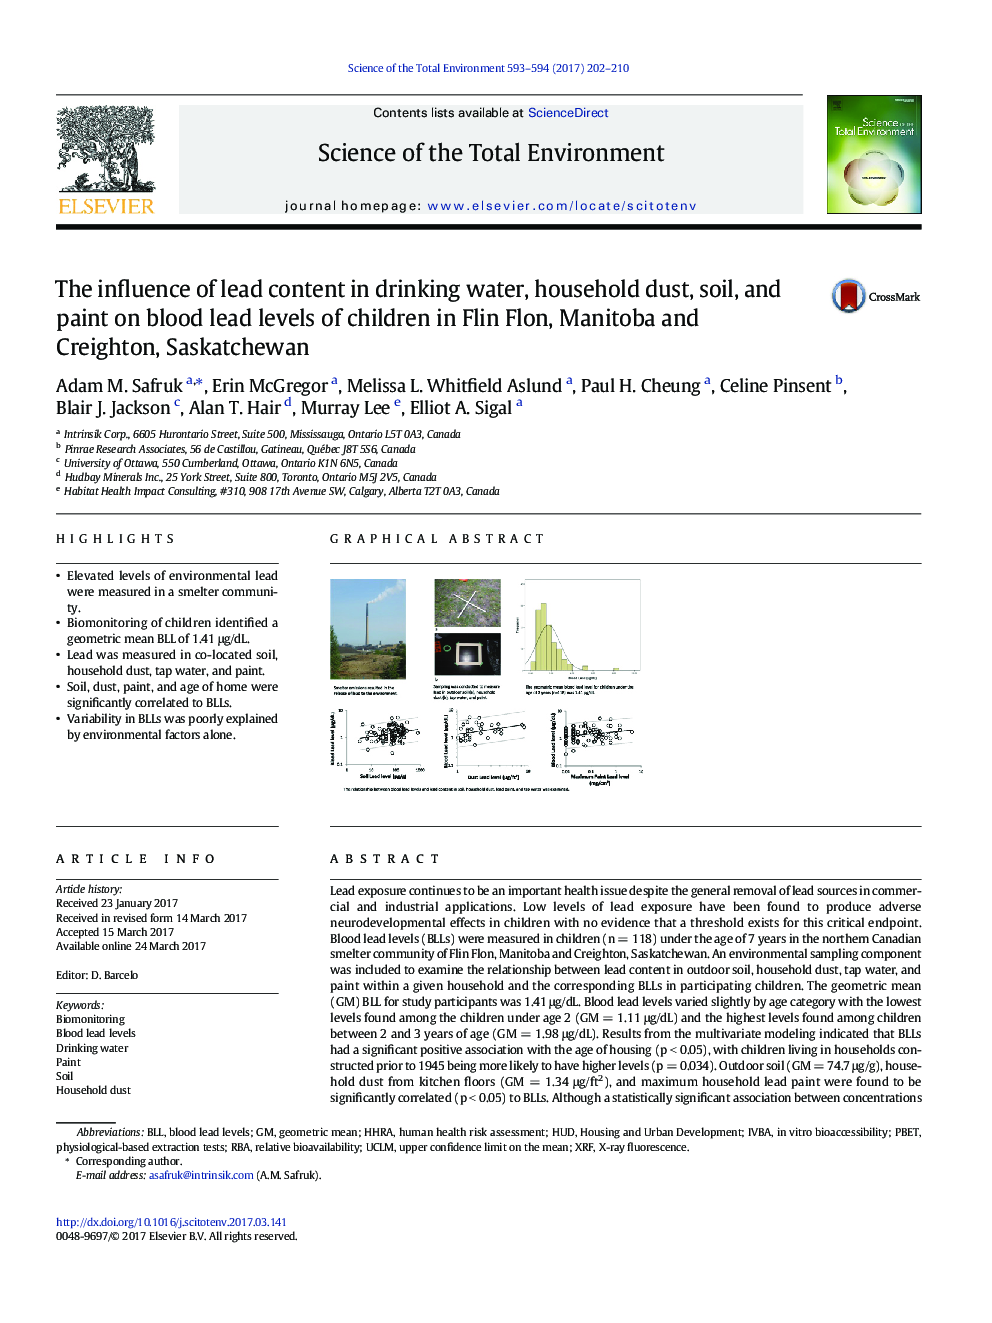
Lead exposure continues to be an important health issue despite the general removal of lead sources in commercial and industrial applications. Low levels of lead exposure have been found to produce adverse neurodevelopmental effects in children with no evidence that a threshold exists for this critical endpoint. Blood lead levels (BLLs) were measured in children (n = 118) under the age of 7 years in the northern Canadian smelter community of Flin Flon, Manitoba and Creighton, Saskatchewan. An environmental sampling component was included to examine the relationship between lead content in outdoor soil, household dust, tap water, and paint within a given household and the corresponding BLLs in participating children. The geometric mean (GM) BLL for study participants was 1.41 μg/dL. Blood lead levels varied slightly by age category with the lowest levels found among the children under age 2 (GM = 1.11 μg/dL) and the highest levels found among children between 2 and 3 years of age (GM = 1.98 μg/dL). Results from the multivariate modeling indicated that BLLs had a significant positive association with the age of housing (p < 0.05), with children living in households constructed prior to 1945 being more likely to have higher levels (p = 0.034). Outdoor soil (GM = 74.7 μg/g), household dust from kitchen floors (GM = 1.34 μg/ft2), and maximum household lead paint were found to be significantly correlated (p < 0.05) to BLLs. Although a statistically significant association between concentrations of lead in these household media and the corresponding BLLs exists, the variability in BLLs was poorly explained by these factors alone (r2 = 0.07, 0.12 and 0.06 for soil, household dust, and paint, respectively). Lead concentrations in flushed (GM = 0.89 μg/L) and stagnant (GM = 2.07 μg/L and 1.18 μg/L) tap water samples were not significantly correlated (p > 0.05) to BLLs.
Graphical abstractDownload high-res image (218KB)Download full-size image
