| Article ID | Journal | Published Year | Pages | File Type |
|---|---|---|---|---|
| 6321809 | Science of The Total Environment | 2016 | 12 Pages |
Abstract
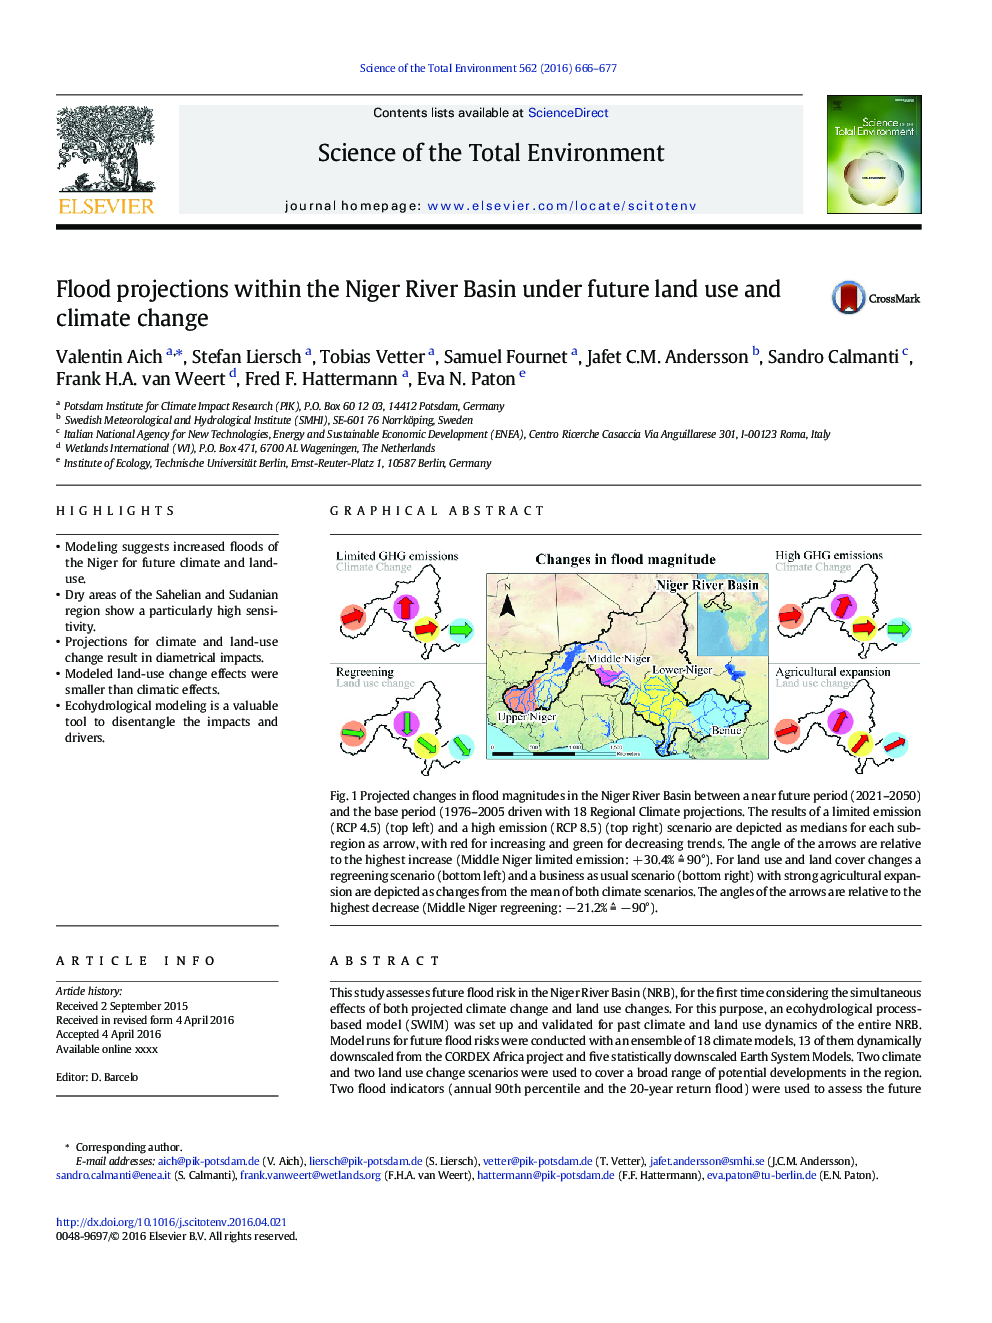
Fig. 1 Projected changes in flood magnitudes in the Niger River Basin between a near future period (2021-2050) and the base period (1976-2005 driven with 18 Regional Climate projections. The results of a limited emission (RCP 4.5) (top left) and a high emission (RCP 8.5) (top right) scenario are depicted as medians for each sub-region as arrow, with red for increasing and green for decreasing trends. The angle of the arrows are relative to the highest increase (Middle Niger limited emission: + 30.4% â 90°). For land use and land cover changes a regreening scenario (bottom left) and a business as usual scenario (bottom right) with strong agricultural expansion are depicted as changes from the mean of both climate scenarios. The angles of the arrows are relative to the highest decrease (Middle Niger regreening: â 21.2% â â 90°).217
Related Topics
Life Sciences
Environmental Science
Environmental Chemistry
Authors
Valentin Aich, Stefan Liersch, Tobias Vetter, Samuel Fournet, Jafet C.M. Andersson, Sandro Calmanti, Frank H.A. van Weert, Fred F. Hattermann, Eva N. Paton,
