| Article ID | Journal | Published Year | Pages | File Type |
|---|---|---|---|---|
| 8852776 | Chemosphere | 2018 | 7 Pages |
Abstract
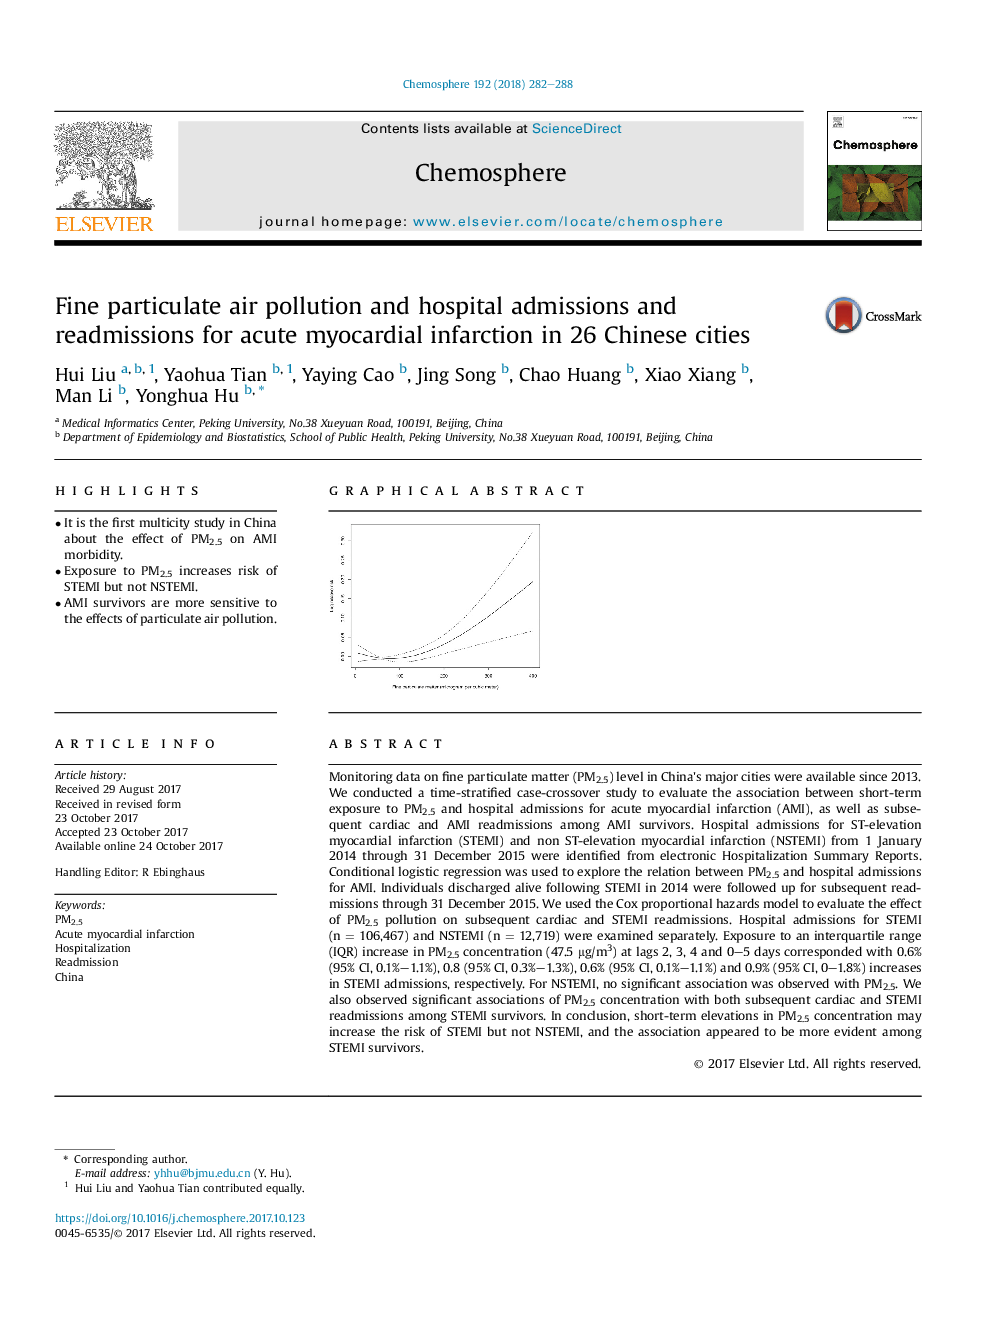
The exposure-response curve of 6-day (lag0-5) moving average fine particulate matter (PM2.5) concentrations and ST-elevation myocardial infarction (STEMI) admissions in 26 cities. Note: The X-axis is the 6-day (lag0-5) moving average PM2.5 concentrations (μg/m3). Y-axis is the predicted log (relative risk (RR)), after adjusting for temperature and relative humidity, is shown by the solid line, and the dotted lines represent the 95% CI.77
Related Topics
Life Sciences
Environmental Science
Environmental Chemistry
Authors
Hui Liu, Yaohua Tian, Yaying Cao, Jing Song, Chao Huang, Xiao Xiang, Man Li, Yonghua Hu,
