| Article ID | Journal | Published Year | Pages | File Type |
|---|---|---|---|---|
| 8859714 | Science of The Total Environment | 2018 | 9 Pages |
Abstract
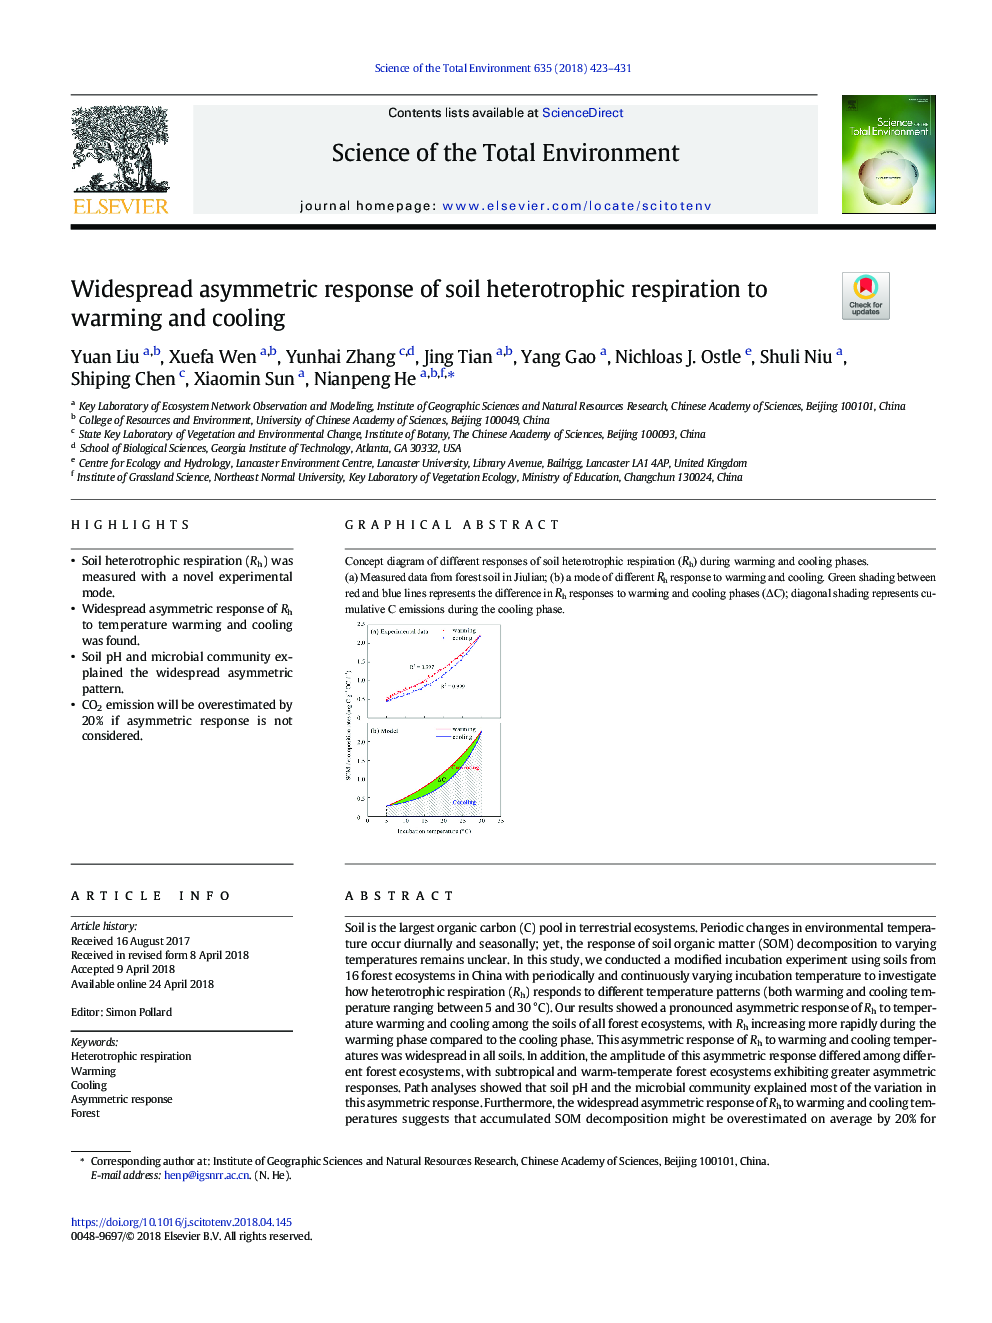
(a) Measured data from forest soil in Jiulian; (b) a mode of different Rh response to warming and cooling. Green shading between red and blue lines represents the difference in Rh responses to warming and cooling phases (ÎC); diagonal shading represents cumulative C emissions during the cooling phase.126
Related Topics
Life Sciences
Environmental Science
Environmental Chemistry
Authors
Yuan Liu, Xuefa Wen, Yunhai Zhang, Jing Tian, Yang Gao, Nichloas J. Ostle, Shuli Niu, Shiping Chen, Xiaomin Sun, Nianpeng He,
