| Article ID | Journal | Published Year | Pages | File Type |
|---|---|---|---|---|
| 4915895 | Applied Energy | 2017 | 13 Pages |
Abstract
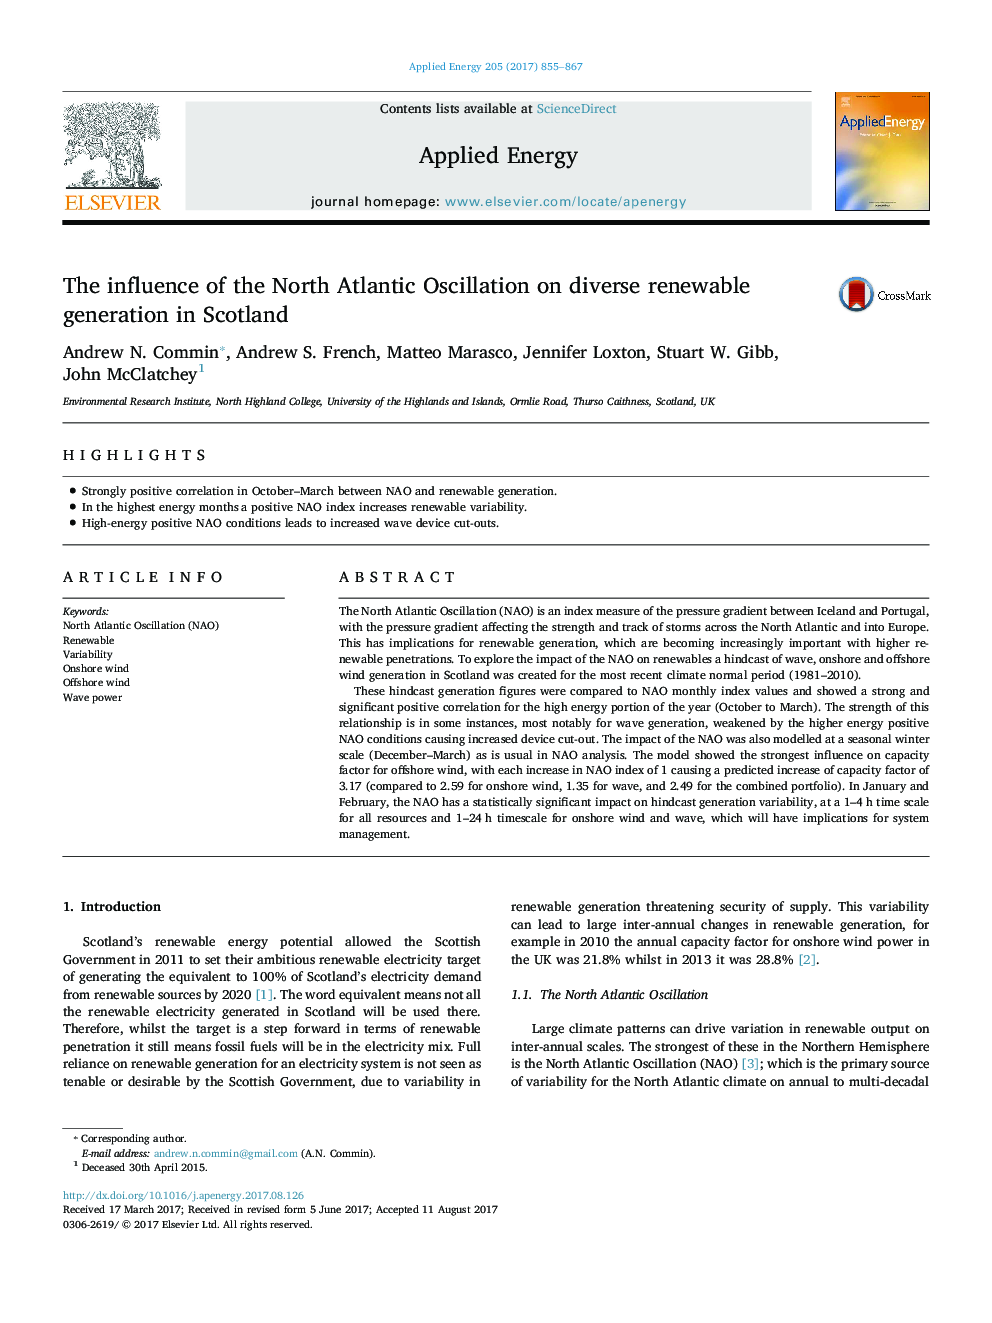
These hindcast generation figures were compared to NAO monthly index values and showed a strong and significant positive correlation for the high energy portion of the year (October to March). The strength of this relationship is in some instances, most notably for wave generation, weakened by the higher energy positive NAO conditions causing increased device cut-out. The impact of the NAO was also modelled at a seasonal winter scale (December-March) as is usual in NAO analysis. The model showed the strongest influence on capacity factor for offshore wind, with each increase in NAO index of 1 causing a predicted increase of capacity factor of 3.17 (compared to 2.59 for onshore wind, 1.35 for wave, and 2.49 for the combined portfolio). In January and February, the NAO has a statistically significant impact on hindcast generation variability, at a 1-4Â h time scale for all resources and 1-24Â h timescale for onshore wind and wave, which will have implications for system management.
Related Topics
Physical Sciences and Engineering
Energy
Energy Engineering and Power Technology
Authors
Andrew N. Commin, Andrew S. French, Matteo Marasco, Jennifer Loxton, Stuart W. Gibb, John McClatchey,
