| کد مقاله | کد نشریه | سال انتشار | مقاله انگلیسی | نسخه تمام متن |
|---|---|---|---|---|
| 5081987 | 1477623 | 2009 | 10 صفحه PDF | دانلود رایگان |
عنوان انگلیسی مقاله ISI
A single control chart for monitoring the frequency and magnitude of an event
دانلود مقاله + سفارش ترجمه
دانلود مقاله ISI انگلیسی
رایگان برای ایرانیان
کلمات کلیدی
موضوعات مرتبط
مهندسی و علوم پایه
سایر رشته های مهندسی
مهندسی صنعتی و تولید
پیش نمایش صفحه اول مقاله

چکیده انگلیسی
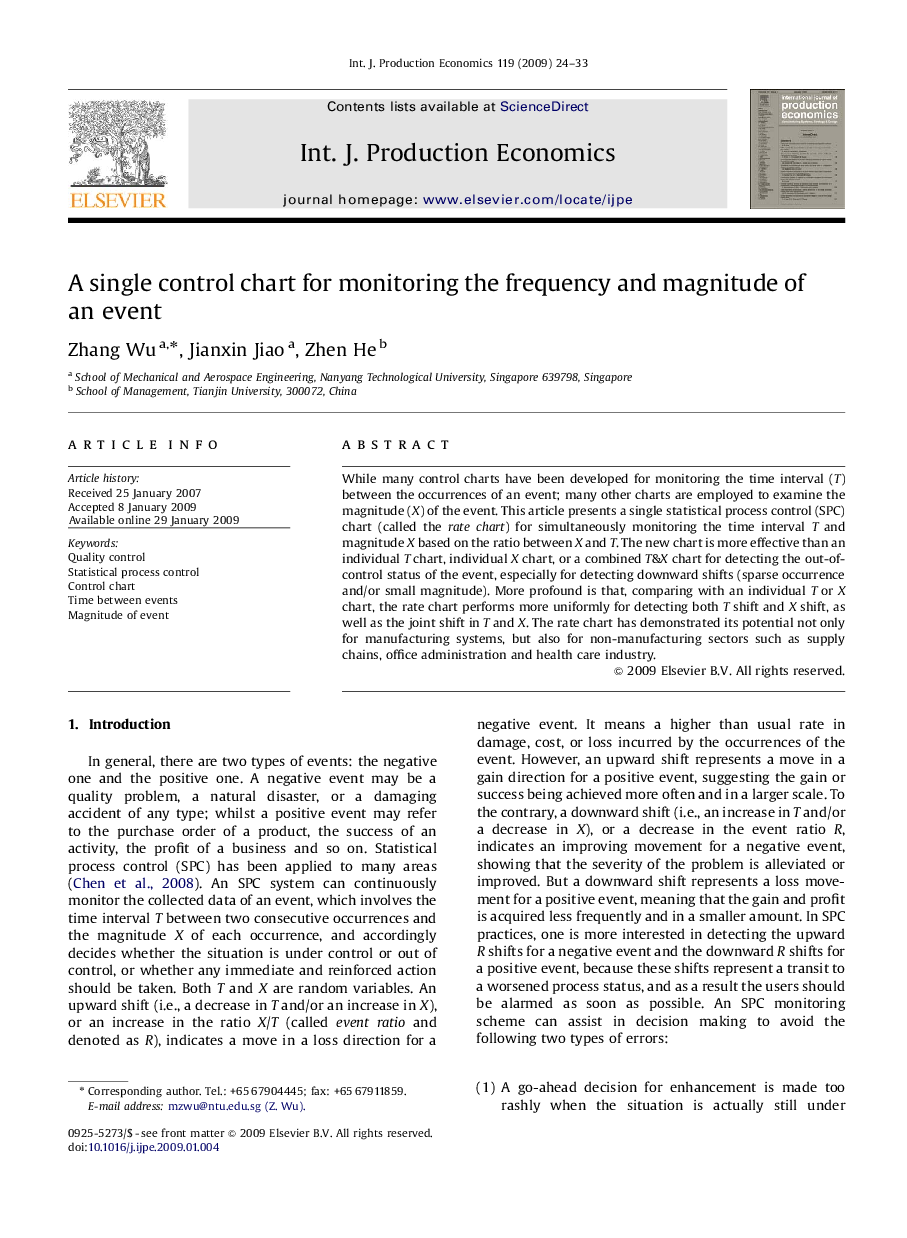
While many control charts have been developed for monitoring the time interval (T) between the occurrences of an event; many other charts are employed to examine the magnitude (X) of the event. This article presents a single statistical process control (SPC) chart (called the rate chart) for simultaneously monitoring the time interval T and magnitude X based on the ratio between X and T. The new chart is more effective than an individual T chart, individual X chart, or a combined T&X chart for detecting the out-of-control status of the event, especially for detecting downward shifts (sparse occurrence and/or small magnitude). More profound is that, comparing with an individual T or X chart, the rate chart performs more uniformly for detecting both T shift and X shift, as well as the joint shift in T and X. The rate chart has demonstrated its potential not only for manufacturing systems, but also for non-manufacturing sectors such as supply chains, office administration and health care industry.
ناشر
Database: Elsevier - ScienceDirect (ساینس دایرکت)
Journal: International Journal of Production Economics - Volume 119, Issue 1, May 2009, Pages 24-33
Journal: International Journal of Production Economics - Volume 119, Issue 1, May 2009, Pages 24-33
نویسندگان
Zhang Wu, Jianxin Jiao, Zhen He,