| کد مقاله | کد نشریه | سال انتشار | مقاله انگلیسی | نسخه تمام متن |
|---|---|---|---|---|
| 9443482 | 1617574 | 2005 | 12 صفحه PDF | دانلود رایگان |
عنوان انگلیسی مقاله ISI
Methods for modelling of temporal and spatial distribution of air temperature at landscape scale in the southern Qilian mountains, China
دانلود مقاله + سفارش ترجمه
دانلود مقاله ISI انگلیسی
رایگان برای ایرانیان
کلمات کلیدی
موضوعات مرتبط
علوم زیستی و بیوفناوری
علوم کشاورزی و بیولوژیک
بوم شناسی، تکامل، رفتار و سامانه شناسی
پیش نمایش صفحه اول مقاله

چکیده انگلیسی
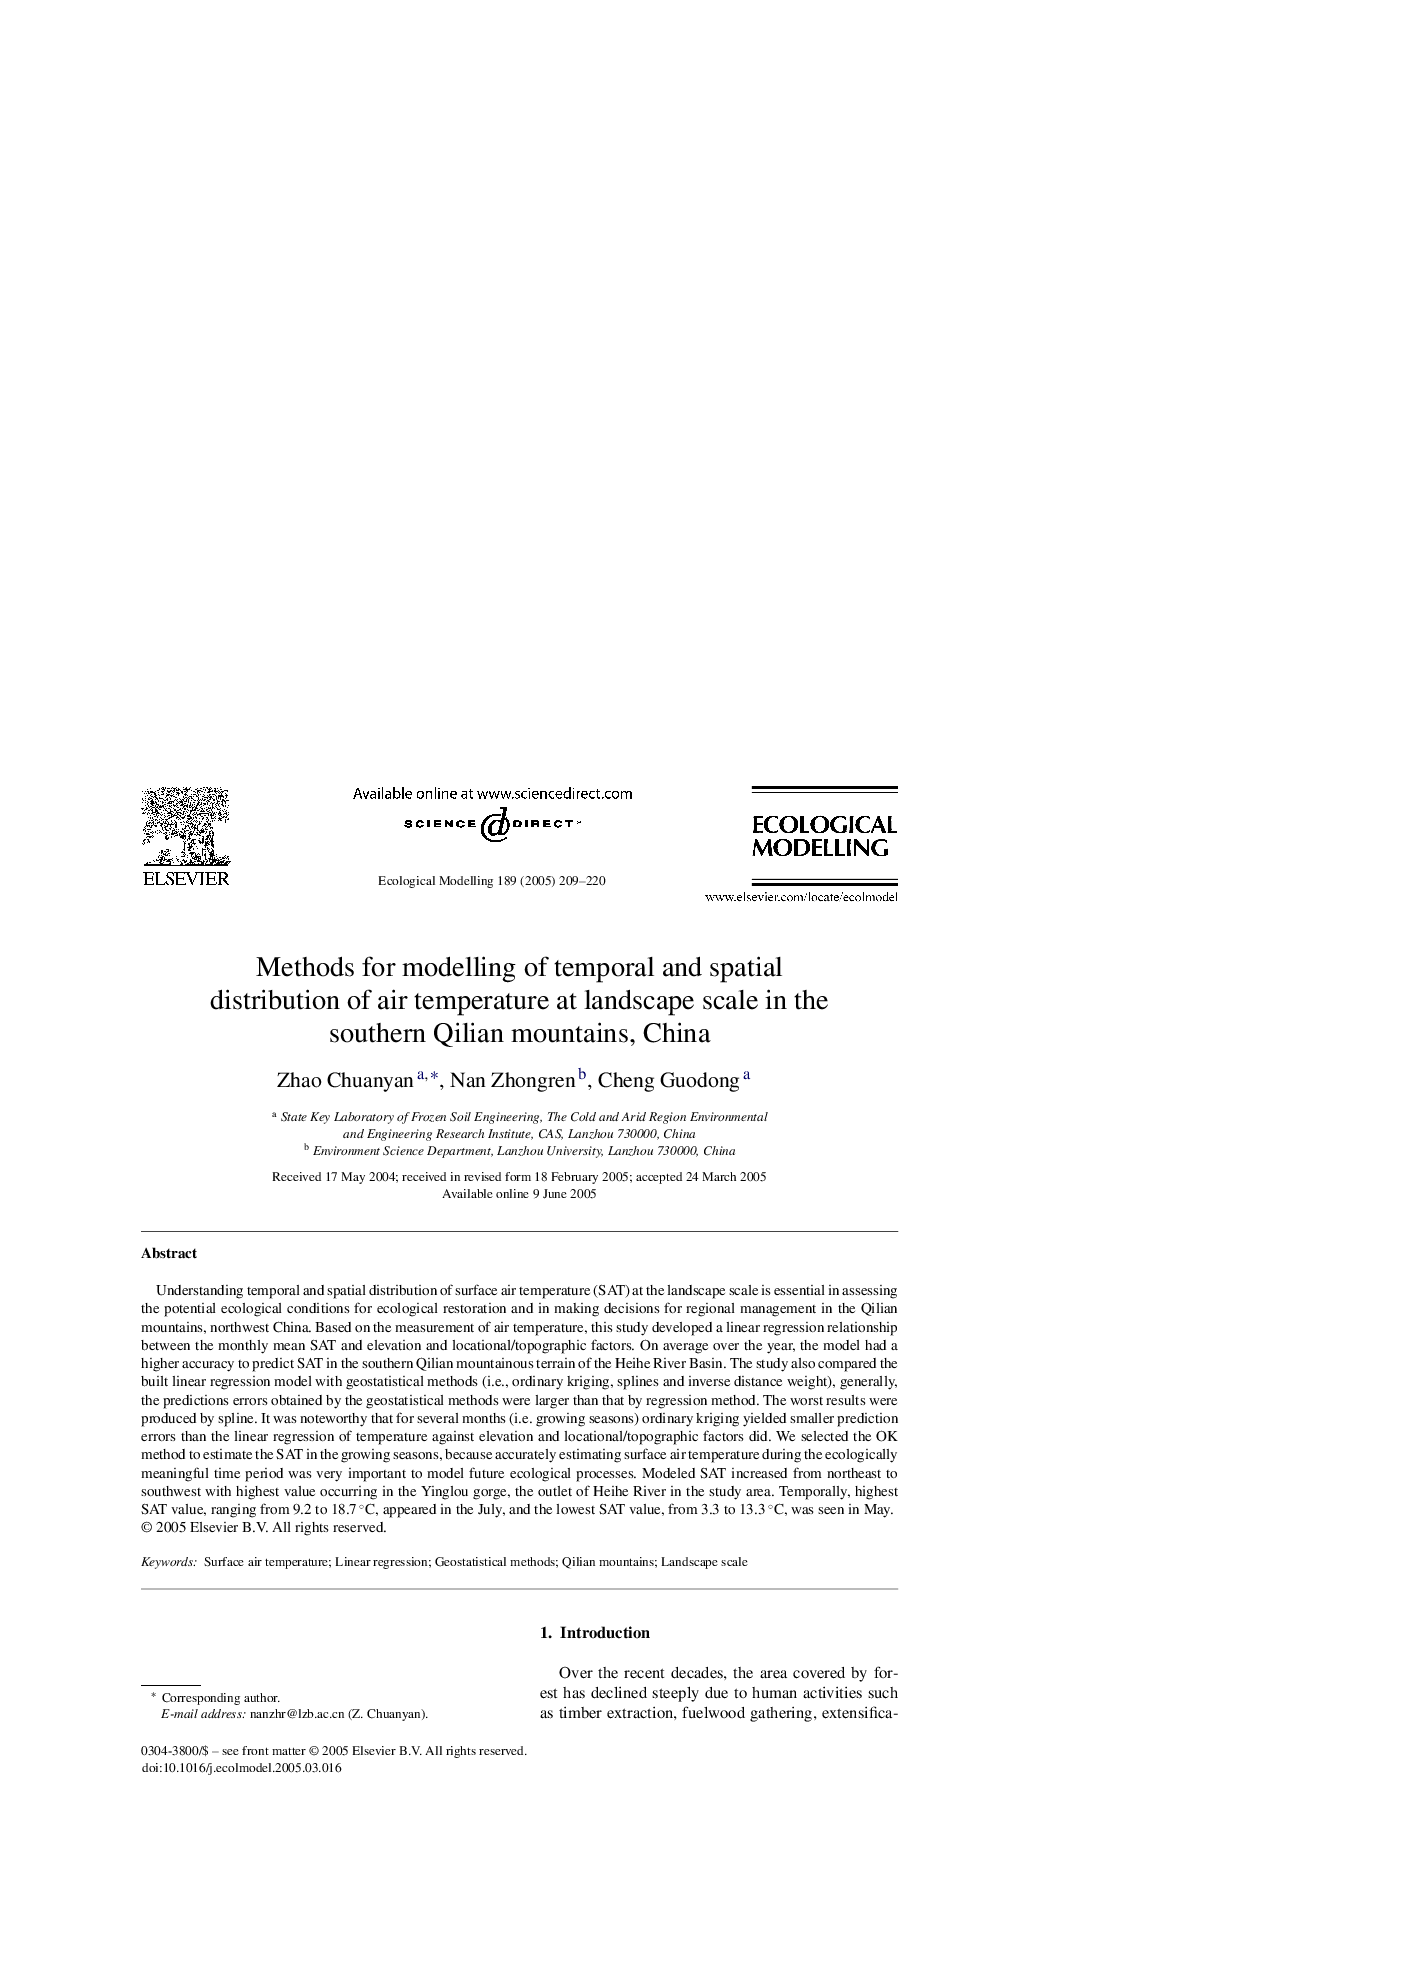
Understanding temporal and spatial distribution of surface air temperature (SAT) at the landscape scale is essential in assessing the potential ecological conditions for ecological restoration and in making decisions for regional management in the Qilian mountains, northwest China. Based on the measurement of air temperature, this study developed a linear regression relationship between the monthly mean SAT and elevation and locational/topographic factors. On average over the year, the model had a higher accuracy to predict SAT in the southern Qilian mountainous terrain of the Heihe River Basin. The study also compared the built linear regression model with geostatistical methods (i.e., ordinary kriging, splines and inverse distance weight), generally, the predictions errors obtained by the geostatistical methods were larger than that by regression method. The worst results were produced by spline. It was noteworthy that for several months (i.e. growing seasons) ordinary kriging yielded smaller prediction errors than the linear regression of temperature against elevation and locational/topographic factors did. We selected the OK method to estimate the SAT in the growing seasons, because accurately estimating surface air temperature during the ecologically meaningful time period was very important to model future ecological processes. Modeled SAT increased from northeast to southwest with highest value occurring in the Yinglou gorge, the outlet of Heihe River in the study area. Temporally, highest SAT value, ranging from 9.2 to 18.7 °C, appeared in the July, and the lowest SAT value, from 3.3 to 13.3 °C, was seen in May.
ناشر
Database: Elsevier - ScienceDirect (ساینس دایرکت)
Journal: Ecological Modelling - Volume 189, Issues 1â2, 25 November 2005, Pages 209-220
Journal: Ecological Modelling - Volume 189, Issues 1â2, 25 November 2005, Pages 209-220
نویسندگان
Zhao Chuanyan, Nan Zhongren, Cheng Guodong,