| کد مقاله | کد نشریه | سال انتشار | مقاله انگلیسی | نسخه تمام متن |
|---|---|---|---|---|
| 6949192 | 1451236 | 2018 | 11 صفحه PDF | دانلود رایگان |
عنوان انگلیسی مقاله ISI
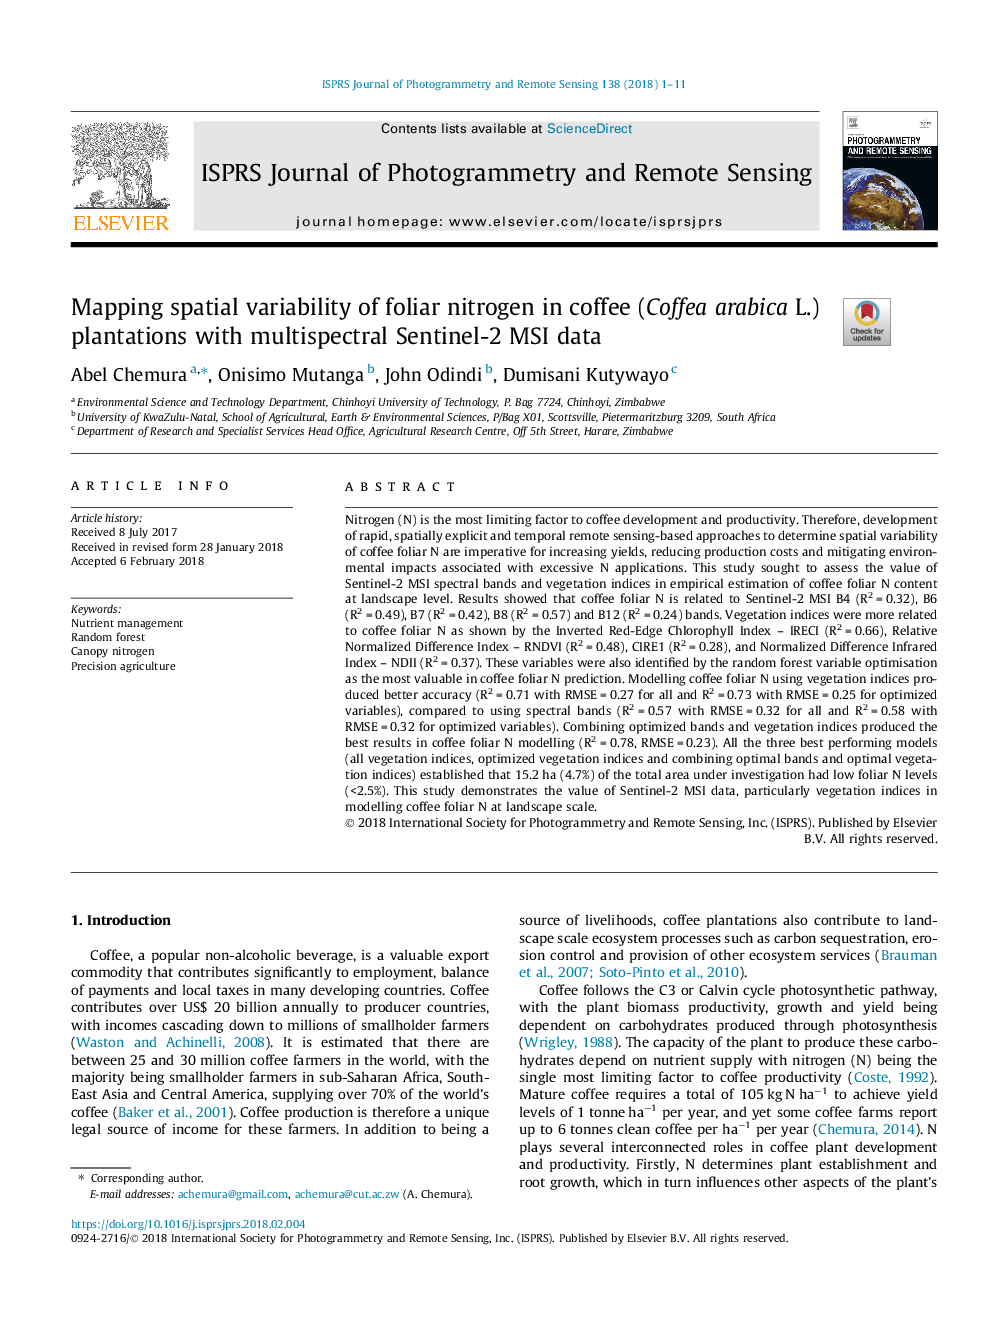
Mapping spatial variability of foliar nitrogen in coffee (Coffea arabica L.) plantations with multispectral Sentinel-2 MSI data
دانلود مقاله + سفارش ترجمه
دانلود مقاله ISI انگلیسی
رایگان برای ایرانیان
کلمات کلیدی
موضوعات مرتبط
مهندسی و علوم پایه
مهندسی کامپیوتر
سیستم های اطلاعاتی
پیش نمایش صفحه اول مقاله

چکیده انگلیسی
Nitrogen (N) is the most limiting factor to coffee development and productivity. Therefore, development of rapid, spatially explicit and temporal remote sensing-based approaches to determine spatial variability of coffee foliar N are imperative for increasing yields, reducing production costs and mitigating environmental impacts associated with excessive N applications. This study sought to assess the value of Sentinel-2 MSI spectral bands and vegetation indices in empirical estimation of coffee foliar N content at landscape level. Results showed that coffee foliar N is related to Sentinel-2 MSI B4 (R2â¯=â¯0.32), B6 (R2â¯=â¯0.49), B7 (R2â¯=â¯0.42), B8 (R2â¯=â¯0.57) and B12 (R2â¯=â¯0.24) bands. Vegetation indices were more related to coffee foliar N as shown by the Inverted Red-Edge Chlorophyll Index - IRECI (R2â¯=â¯0.66), Relative Normalized Difference Index - RNDVI (R2â¯=â¯0.48), CIRE1 (R2â¯=â¯0.28), and Normalized Difference Infrared Index - NDII (R2â¯=â¯0.37). These variables were also identified by the random forest variable optimisation as the most valuable in coffee foliar N prediction. Modelling coffee foliar N using vegetation indices produced better accuracy (R2â¯=â¯0.71 with RMSEâ¯=â¯0.27 for all and R2â¯=â¯0.73 with RMSEâ¯=â¯0.25 for optimized variables), compared to using spectral bands (R2â¯=â¯0.57 with RMSEâ¯=â¯0.32 for all and R2â¯=â¯0.58 with RMSEâ¯=â¯0.32 for optimized variables). Combining optimized bands and vegetation indices produced the best results in coffee foliar N modelling (R2â¯=â¯0.78, RMSEâ¯=â¯0.23). All the three best performing models (all vegetation indices, optimized vegetation indices and combining optimal bands and optimal vegetation indices) established that 15.2â¯ha (4.7%) of the total area under investigation had low foliar N levels (<2.5%). This study demonstrates the value of Sentinel-2 MSI data, particularly vegetation indices in modelling coffee foliar N at landscape scale.
ناشر
Database: Elsevier - ScienceDirect (ساینس دایرکت)
Journal: ISPRS Journal of Photogrammetry and Remote Sensing - Volume 138, April 2018, Pages 1-11
Journal: ISPRS Journal of Photogrammetry and Remote Sensing - Volume 138, April 2018, Pages 1-11
نویسندگان
Abel Chemura, Onisimo Mutanga, John Odindi, Dumisani Kutywayo,