| کد مقاله | کد نشریه | سال انتشار | مقاله انگلیسی | نسخه تمام متن |
|---|---|---|---|---|
| 8777717 | 1599450 | 2018 | 5 صفحه PDF | دانلود رایگان |
عنوان انگلیسی مقاله ISI
WASP (Write a Scientific Paper) using Excel - 2: Pivot tables
دانلود مقاله + سفارش ترجمه
دانلود مقاله ISI انگلیسی
رایگان برای ایرانیان
کلمات کلیدی
موضوعات مرتبط
علوم پزشکی و سلامت
پزشکی و دندانپزشکی
زنان، زایمان و بهداشت زنان
پیش نمایش صفحه اول مقاله

چکیده انگلیسی
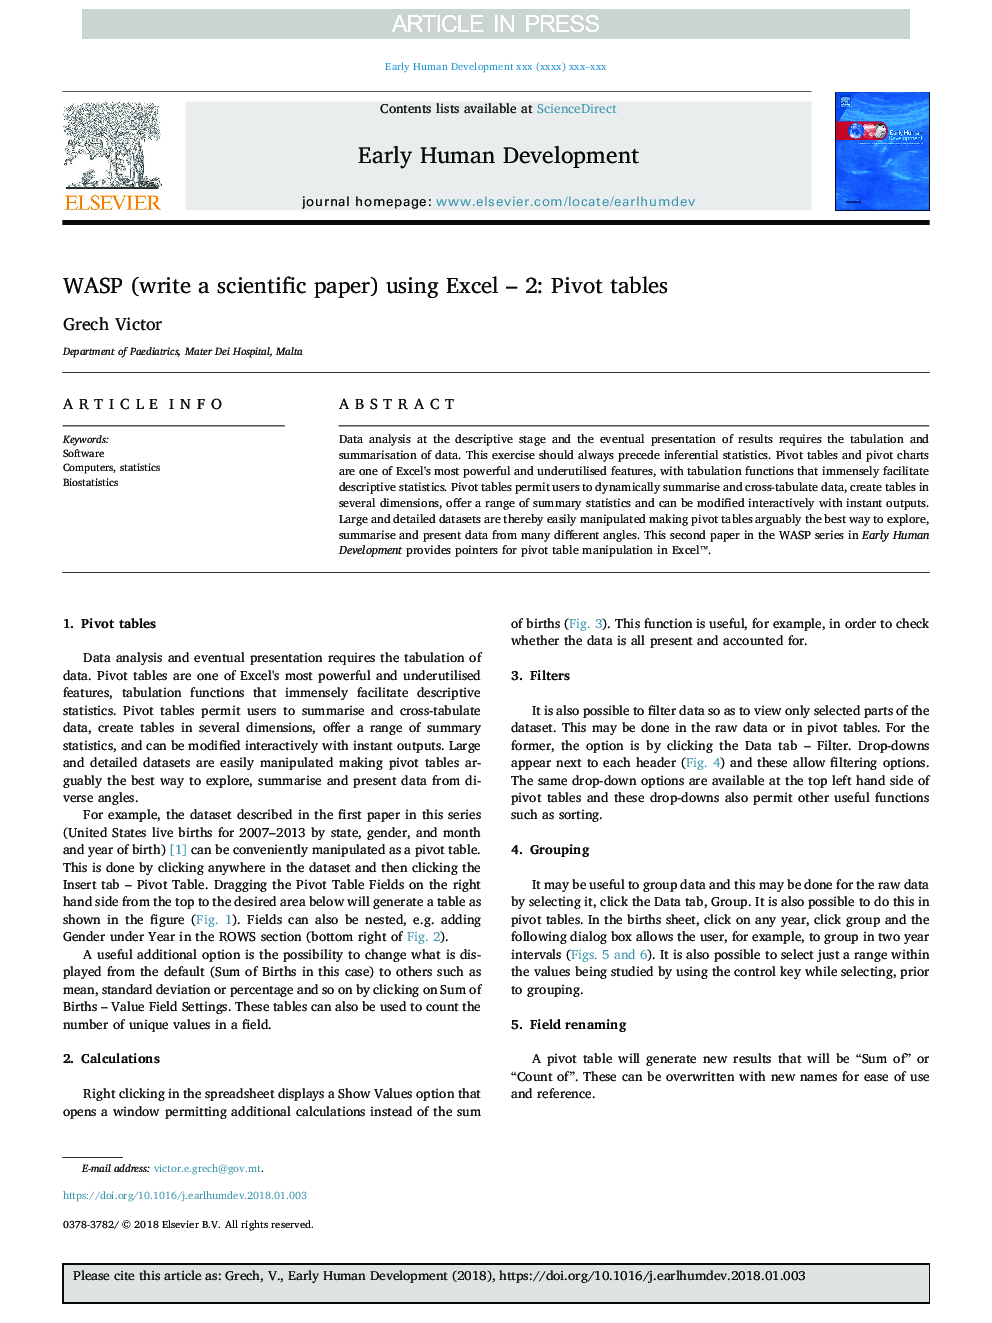
Data analysis at the descriptive stage and the eventual presentation of results requires the tabulation and summarisation of data. This exercise should always precede inferential statistics. Pivot tables and pivot charts are one of Excel's most powerful and underutilised features, with tabulation functions that immensely facilitate descriptive statistics. Pivot tables permit users to dynamically summarise and cross-tabulate data, create tables in several dimensions, offer a range of summary statistics and can be modified interactively with instant outputs. Large and detailed datasets are thereby easily manipulated making pivot tables arguably the best way to explore, summarise and present data from many different angles. This second paper in the WASP series in Early Human Development provides pointers for pivot table manipulation in Excelâ¢.
ناشر
Database: Elsevier - ScienceDirect (ساینس دایرکت)
Journal: Early Human Development - Volume 117, February 2018, Pages 104-109
Journal: Early Human Development - Volume 117, February 2018, Pages 104-109
نویسندگان
Grech Victor,