| کد مقاله | کد نشریه | سال انتشار | مقاله انگلیسی | نسخه تمام متن |
|---|---|---|---|---|
| 10508473 | 948487 | 2015 | 21 صفحه PDF | دانلود رایگان |
عنوان انگلیسی مقاله ISI
Spatio-temporal interpolation of soil water, temperature, and electrical conductivity in 3DÂ +Â T: The Cook Agronomy Farm data set
دانلود مقاله + سفارش ترجمه
دانلود مقاله ISI انگلیسی
رایگان برای ایرانیان
کلمات کلیدی
موضوعات مرتبط
مهندسی و علوم پایه
علوم زمین و سیارات
علوم زمین و سیاره ای (عمومی)
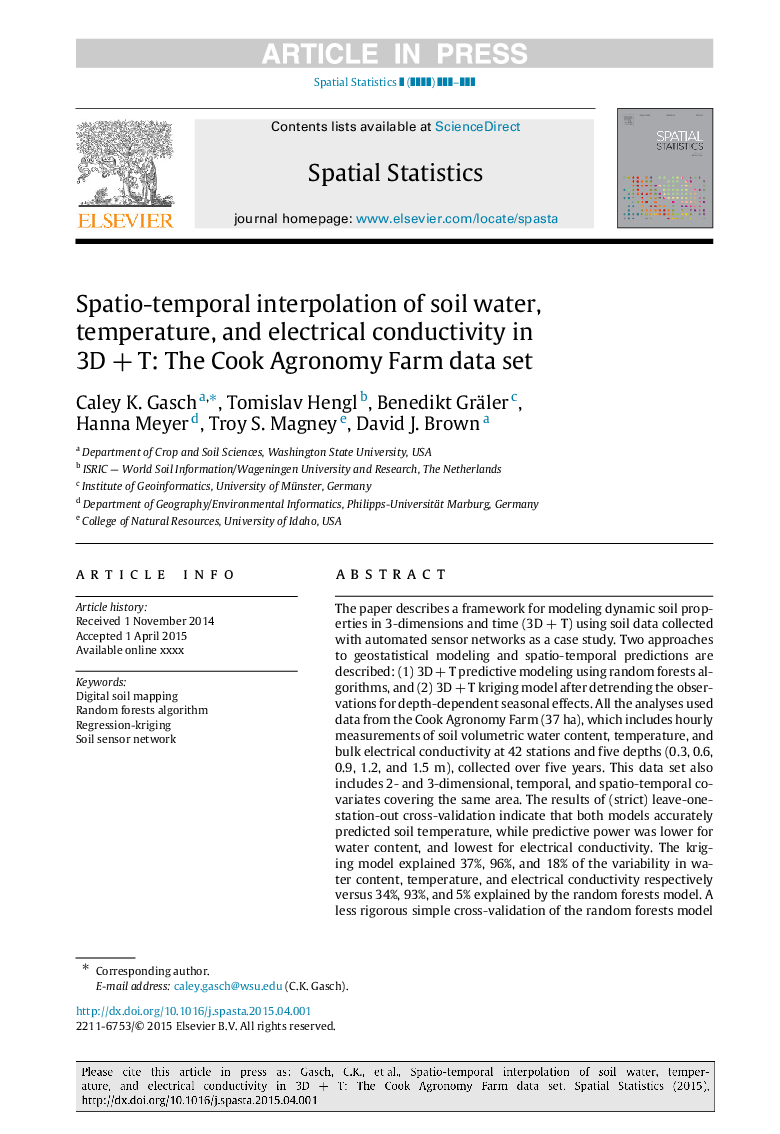
پیش نمایش صفحه اول مقاله

چکیده انگلیسی
The paper describes a framework for modeling dynamic soil properties in 3-dimensions and time (3DÂ +Â T) using soil data collected with automated sensor networks as a case study. Two approaches to geostatistical modeling and spatio-temporal predictions are described: (1) 3DÂ +Â T predictive modeling using random forests algorithms, and (2) 3DÂ +Â T kriging model after detrending the observations for depth-dependent seasonal effects. All the analyses used data from the Cook Agronomy Farm (37 ha), which includes hourly measurements of soil volumetric water content, temperature, and bulk electrical conductivity at 42 stations and five depths (0.3, 0.6, 0.9, 1.2, and 1.5 m), collected over five years. This data set also includes 2- and 3-dimensional, temporal, and spatio-temporal covariates covering the same area. The results of (strict) leave-one-station-out cross-validation indicate that both models accurately predicted soil temperature, while predictive power was lower for water content, and lowest for electrical conductivity. The kriging model explained 37%, 96%, and 18% of the variability in water content, temperature, and electrical conductivity respectively versus 34%, 93%, and 5% explained by the random forests model. A less rigorous simple cross-validation of the random forests model indicated improved predictive power when at least some data were available for each station, explaining 86%, 97%, and 88% of the variability in water content, temperature, and electrical conductivity respectively. The high difference between the strict and simple cross-validation indicates high temporal auto-correlation of values at measurement stations. Temporal model components (i.e. day of the year and seasonal trends) explained most of the variability in observations in both models for all three variables. The seamless predictions of 3DÂ +Â T data produced from this analysis can assist in understanding soil processes and how they change through a season, under different land management scenarios, and how they relate to other environmental processes.
ناشر
Database: Elsevier - ScienceDirect (ساینس دایرکت)
Journal: Spatial Statistics - Volume 14, Part A, November 2015, Pages 70-90
Journal: Spatial Statistics - Volume 14, Part A, November 2015, Pages 70-90
نویسندگان
Caley K. Gasch, Tomislav Hengl, Benedikt Gräler, Hanna Meyer, Troy S. Magney, David J. Brown,