| کد مقاله | کد نشریه | سال انتشار | مقاله انگلیسی | نسخه تمام متن |
|---|---|---|---|---|
| 1230158 | 1495243 | 2014 | 5 صفحه PDF | دانلود رایگان |

• Calcite is a rock-forming mineral with a chemical formula CaCO3.
• Compositional analysis of calcite was carried out.
• Thermoluminescence of X-ray and UV irradiated calcite were studied.
• Emission spectra of X-ray and UV induced calcite sample were studied.
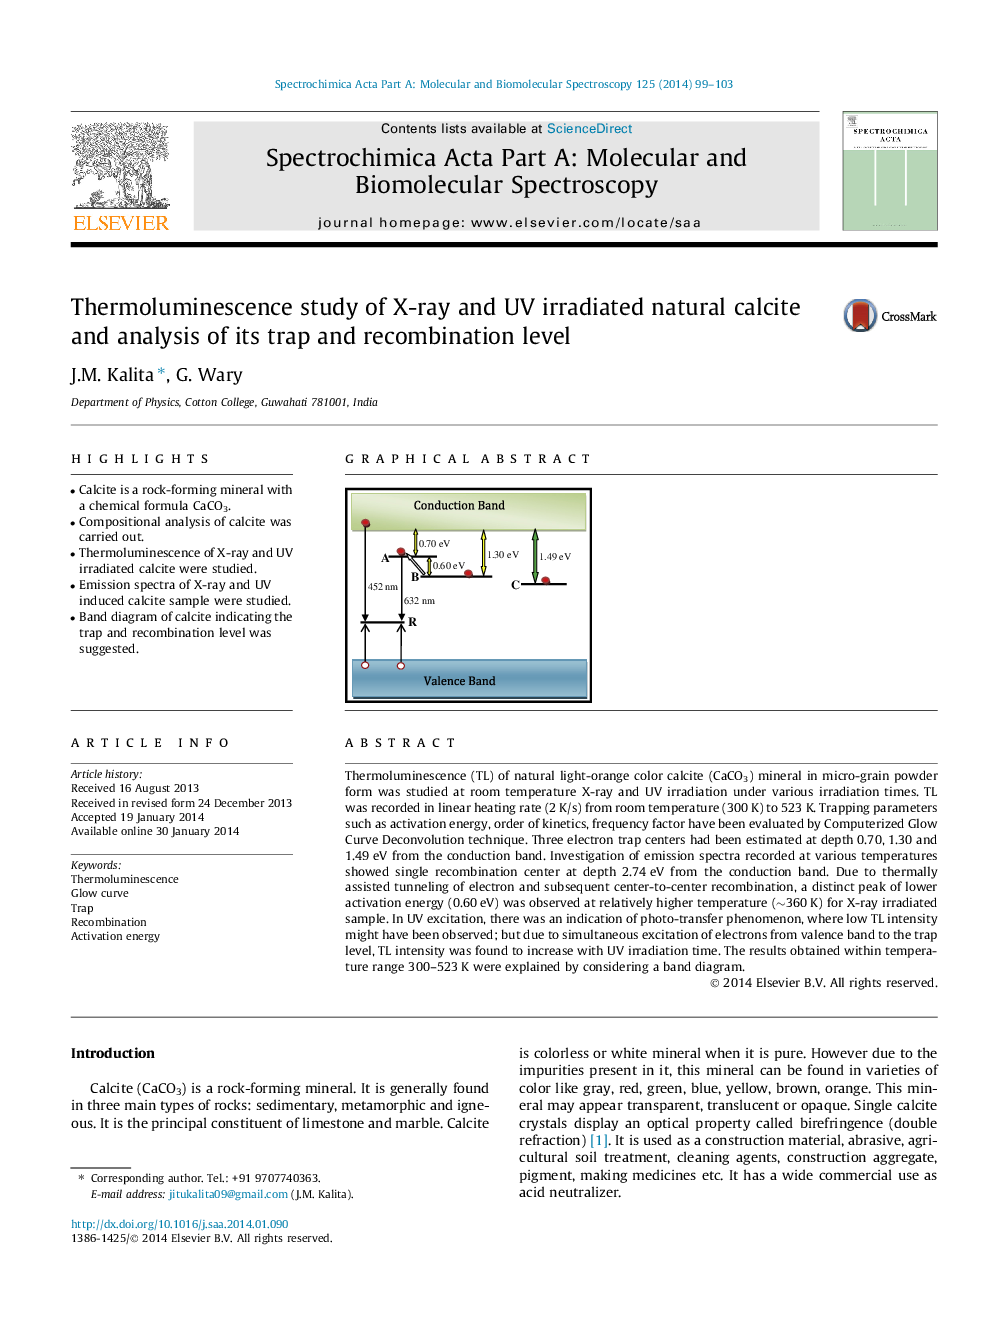
• Band diagram of calcite indicating the trap and recombination level was suggested.
Thermoluminescence (TL) of natural light-orange color calcite (CaCO3) mineral in micro-grain powder form was studied at room temperature X-ray and UV irradiation under various irradiation times. TL was recorded in linear heating rate (2 K/s) from room temperature (300 K) to 523 K. Trapping parameters such as activation energy, order of kinetics, frequency factor have been evaluated by Computerized Glow Curve Deconvolution technique. Three electron trap centers had been estimated at depth 0.70, 1.30 and 1.49 eV from the conduction band. Investigation of emission spectra recorded at various temperatures showed single recombination center at depth 2.74 eV from the conduction band. Due to thermally assisted tunneling of electron and subsequent center-to-center recombination, a distinct peak of lower activation energy (0.60 eV) was observed at relatively higher temperature (∼360 K) for X-ray irradiated sample. In UV excitation, there was an indication of photo-transfer phenomenon, where low TL intensity might have been observed; but due to simultaneous excitation of electrons from valence band to the trap level, TL intensity was found to increase with UV irradiation time. The results obtained within temperature range 300–523 K were explained by considering a band diagram.
Figure optionsDownload as PowerPoint slide
Journal: Spectrochimica Acta Part A: Molecular and Biomolecular Spectroscopy - Volume 125, 5 May 2014, Pages 99–103