| کد مقاله | کد نشریه | سال انتشار | مقاله انگلیسی | نسخه تمام متن |
|---|---|---|---|---|
| 1491559 | 992354 | 2008 | 6 صفحه PDF | دانلود رایگان |
عنوان انگلیسی مقاله ISI
The phase diagram YF3–GdF3
دانلود مقاله + سفارش ترجمه
دانلود مقاله ISI انگلیسی
رایگان برای ایرانیان
کلمات کلیدی
موضوعات مرتبط
مهندسی و علوم پایه
مهندسی مواد
سرامیک و کامپوزیت
پیش نمایش صفحه اول مقاله

چکیده انگلیسی
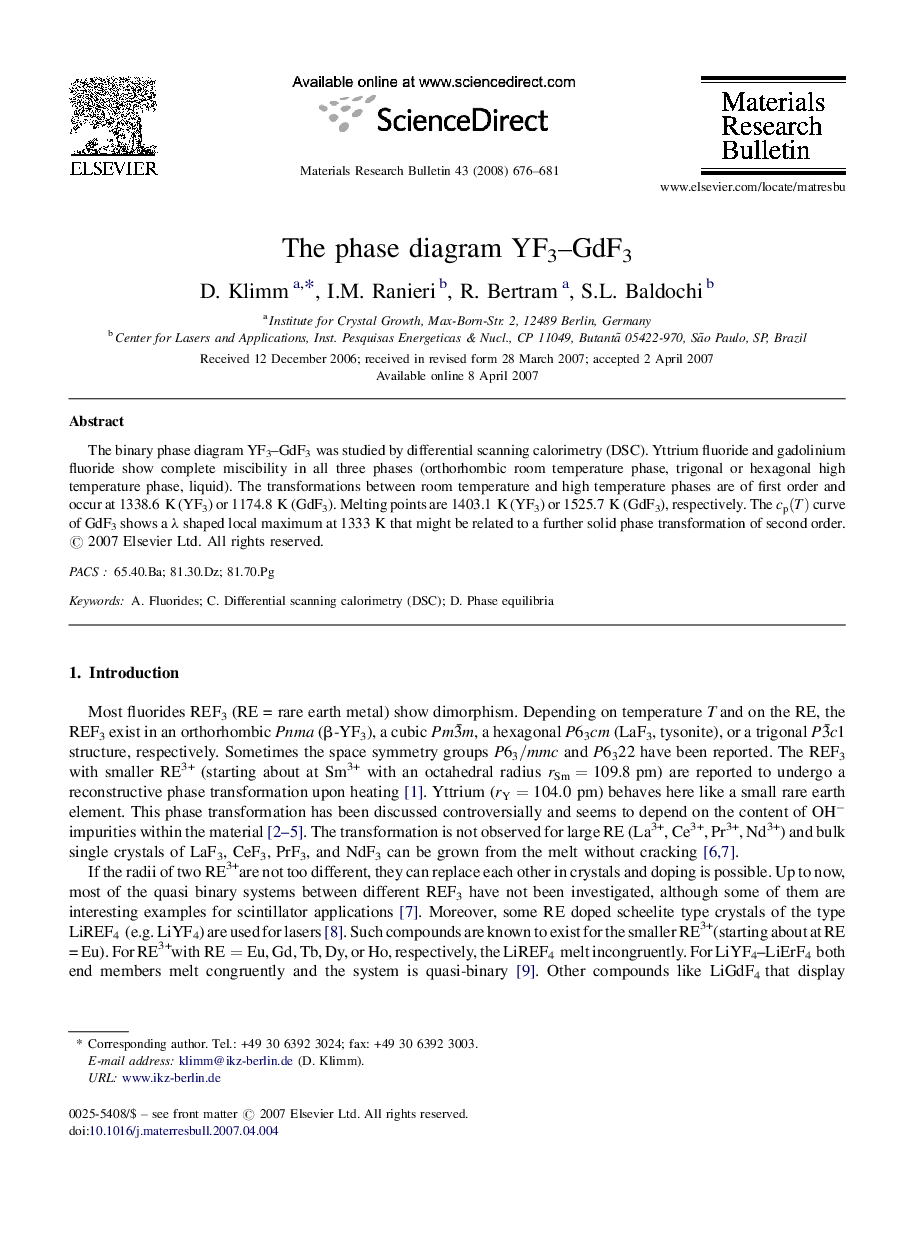
The binary phase diagram YF3–GdF3 was studied by differential scanning calorimetry (DSC). Yttrium fluoride and gadolinium fluoride show complete miscibility in all three phases (orthorhombic room temperature phase, trigonal or hexagonal high temperature phase, liquid). The transformations between room temperature and high temperature phases are of first order and occur at 1338.6 K (YF3) or 1174.8 K (GdF3). Melting points are 1403.1 K (YF3) or 1525.7 K (GdF3), respectively. The cp(T)cp(T) curve of GdF3 shows a λλ shaped local maximum at 1333 K that might be related to a further solid phase transformation of second order.
ناشر
Database: Elsevier - ScienceDirect (ساینس دایرکت)
Journal: Materials Research Bulletin - Volume 43, Issue 3, 4 March 2008, Pages 676–681
Journal: Materials Research Bulletin - Volume 43, Issue 3, 4 March 2008, Pages 676–681
نویسندگان
D. Klimm, I.M. Ranieri, R. Bertram, S.L. Baldochi,