| کد مقاله | کد نشریه | سال انتشار | مقاله انگلیسی | نسخه تمام متن |
|---|---|---|---|---|
| 1691141 | 1011297 | 2009 | 6 صفحه PDF | دانلود رایگان |
عنوان انگلیسی مقاله ISI
Analysis of surface states and series resistance in Au/n-Si Schottky diodes with insulator layer using current-voltage and admittance-voltage characteristics
دانلود مقاله + سفارش ترجمه
دانلود مقاله ISI انگلیسی
رایگان برای ایرانیان
کلمات کلیدی
موضوعات مرتبط
مهندسی و علوم پایه
مهندسی مواد
سطوح، پوششها و فیلمها
پیش نمایش صفحه اول مقاله

چکیده انگلیسی
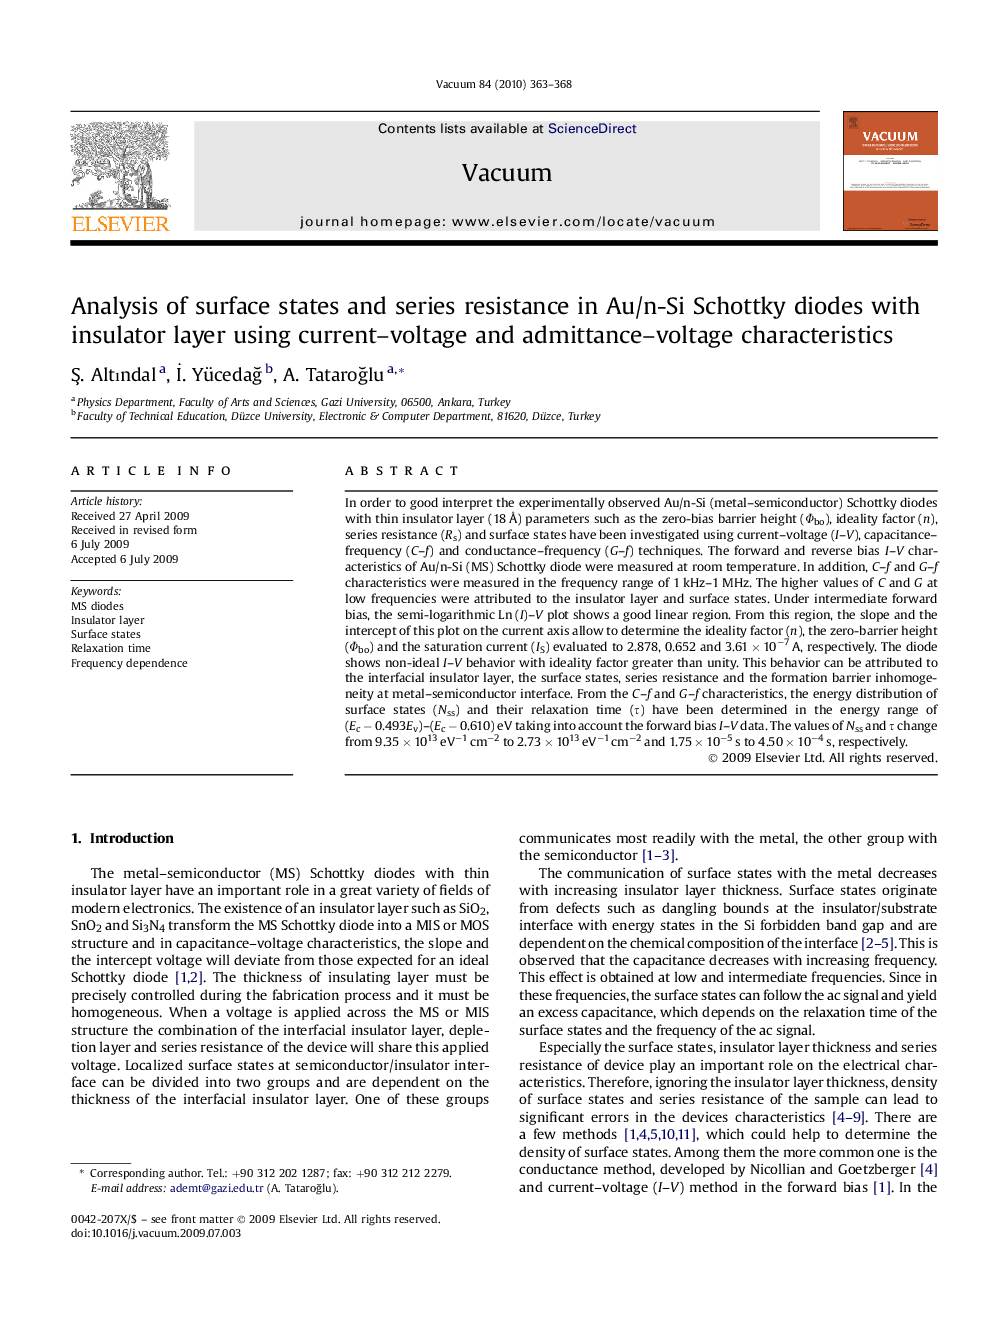
In order to good interpret the experimentally observed Au/n-Si (metal-semiconductor) Schottky diodes with thin insulator layer (18Â Ã
) parameters such as the zero-bias barrier height (Φbo), ideality factor (n), series resistance (Rs) and surface states have been investigated using current-voltage (I-V), capacitance-frequency (C-f) and conductance-frequency (G-f) techniques. The forward and reverse bias I-V characteristics of Au/n-Si (MS) Schottky diode were measured at room temperature. In addition, C-f and G-f characteristics were measured in the frequency range of 1 kHz-1 MHz. The higher values of C and G at low frequencies were attributed to the insulator layer and surface states. Under intermediate forward bias, the semi-logarithmic Ln (I)-V plot shows a good linear region. From this region, the slope and the intercept of this plot on the current axis allow to determine the ideality factor (n), the zero-barrier height (Φbo) and the saturation current (IS) evaluated to 2.878, 0.652 and 3.61 Ã 10â7 A, respectively. The diode shows non-ideal I-V behavior with ideality factor greater than unity. This behavior can be attributed to the interfacial insulator layer, the surface states, series resistance and the formation barrier inhomogeneity at metal-semiconductor interface. From the C-f and G-f characteristics, the energy distribution of surface states (Nss) and their relaxation time (Ï) have been determined in the energy range of (Ec â 0.493Ev)-(Ec â 0.610) eV taking into account the forward bias I-V data. The values of Nss and Ï change from 9.35 Ã 1013 eVâ1 cmâ2 to 2.73 Ã 1013 eVâ1 cmâ2 and 1.75 Ã 10â5 s to 4.50 Ã 10â4 s, respectively.
ناشر
Database: Elsevier - ScienceDirect (ساینس دایرکت)
Journal: Vacuum - Volume 84, Issue 3, 5 November 2009, Pages 363-368
Journal: Vacuum - Volume 84, Issue 3, 5 November 2009, Pages 363-368
نویسندگان
Å. Altındal, Ä°. YücedaÄ, A. TataroÄlu,