| کد مقاله | کد نشریه | سال انتشار | مقاله انگلیسی | نسخه تمام متن |
|---|---|---|---|---|
| 6842698 | 1435910 | 2018 | 11 صفحه PDF | دانلود رایگان |
عنوان انگلیسی مقاله ISI
Using Tableau to visualize data and drive decision-making
دانلود مقاله + سفارش ترجمه
دانلود مقاله ISI انگلیسی
رایگان برای ایرانیان
کلمات کلیدی
موضوعات مرتبط
علوم انسانی و اجتماعی
مدیریت، کسب و کار و حسابداری
حسابداری
پیش نمایش صفحه اول مقاله

چکیده انگلیسی
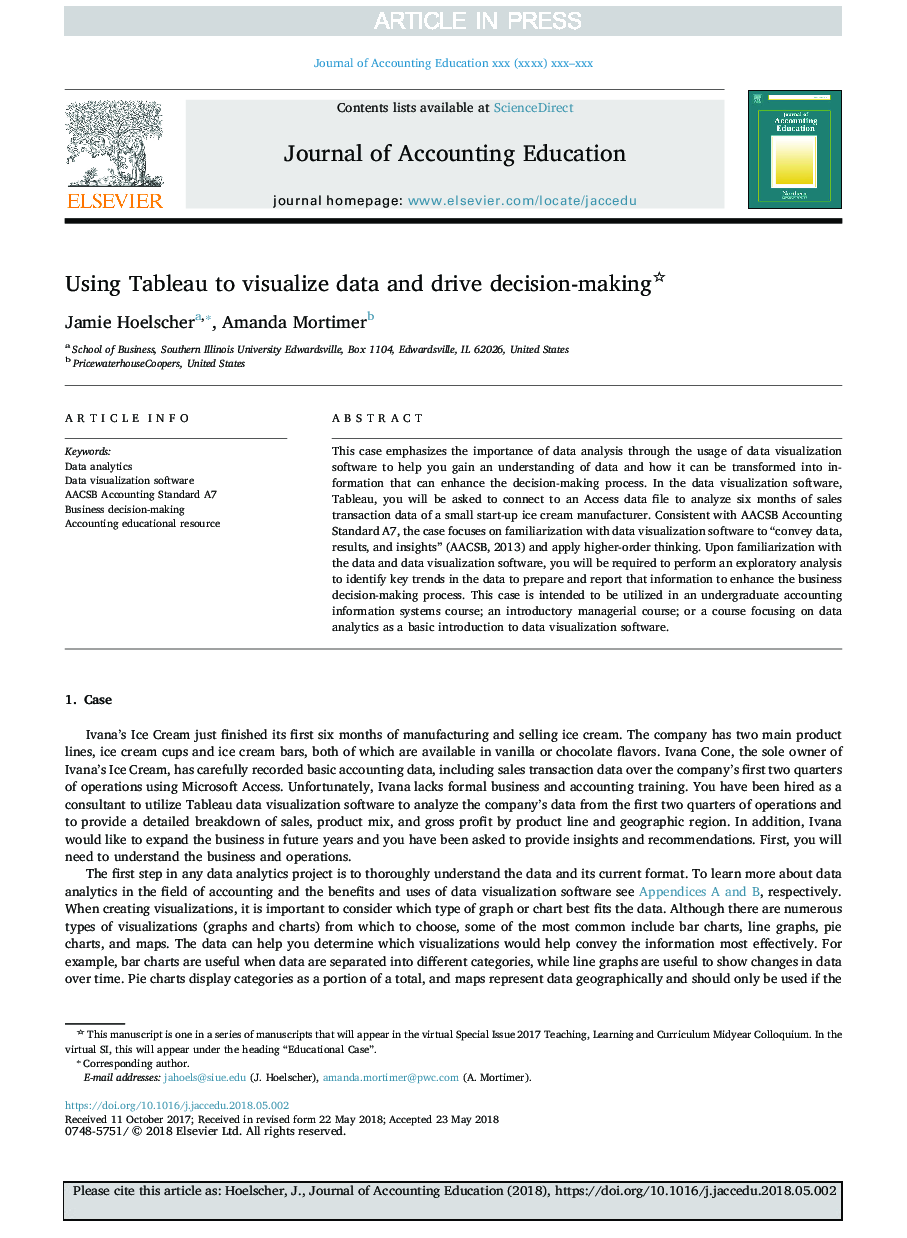
This case emphasizes the importance of data analysis through the usage of data visualization software to help you gain an understanding of data and how it can be transformed into information that can enhance the decision-making process. In the data visualization software, Tableau, you will be asked to connect to an Access data file to analyze six months of sales transaction data of a small start-up ice cream manufacturer. Consistent with AACSB Accounting Standard A7, the case focuses on familiarization with data visualization software to “convey data, results, and insights” (AACSB, 2013) and apply higher-order thinking. Upon familiarization with the data and data visualization software, you will be required to perform an exploratory analysis to identify key trends in the data to prepare and report that information to enhance the business decision-making process. This case is intended to be utilized in an undergraduate accounting information systems course; an introductory managerial course; or a course focusing on data analytics as a basic introduction to data visualization software.
ناشر
Database: Elsevier - ScienceDirect (ساینس دایرکت)
Journal: Journal of Accounting Education - Volume 44, September 2018, Pages 49-59
Journal: Journal of Accounting Education - Volume 44, September 2018, Pages 49-59
نویسندگان
Jamie Hoelscher, Amanda Mortimer,