| کد مقاله | کد نشریه | سال انتشار | مقاله انگلیسی | نسخه تمام متن |
|---|---|---|---|---|
| 6324844 | 1619742 | 2016 | 11 صفحه PDF | دانلود رایگان |
- Nitrous oxide, methane and carbon dioxide emission were quantified from soils under cereals, millets, oilseeds, and pulses in northwest India.
- The emission of nitrous oxide ranged from 0.57-1.3 kg haâ 1, methane from 27.78-29.50 kg haâ 1 and carbon dioxide from 2377-3910 kg haâ 1.
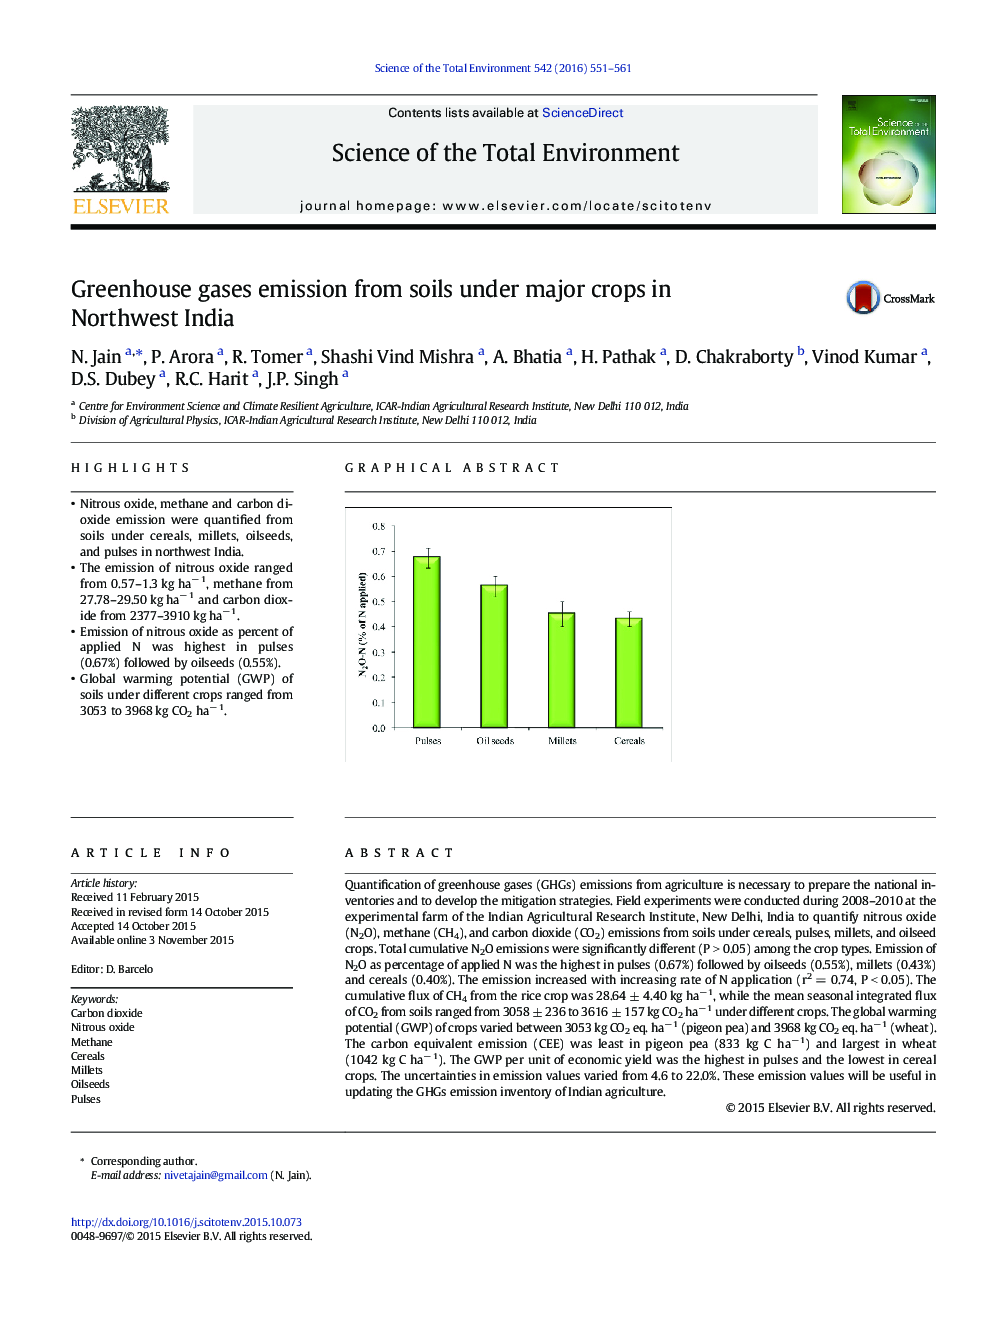
- Emission of nitrous oxide as percent of applied N was highest in pulses (0.67%) followed by oilseeds (0.55%).
- Global warming potential (GWP) of soils under different crops ranged from 3053 to 3968 kg CO2 haâ 1.
Quantification of greenhouse gases (GHGs) emissions from agriculture is necessary to prepare the national inventories and to develop the mitigation strategies. Field experiments were conducted during 2008-2010 at the experimental farm of the Indian Agricultural Research Institute, New Delhi, India to quantify nitrous oxide (N2O), methane (CH4), and carbon dioxide (CO2) emissions from soils under cereals, pulses, millets, and oilseed crops. Total cumulative N2O emissions were significantly different (P > 0.05) among the crop types. Emission of N2O as percentage of applied N was the highest in pulses (0.67%) followed by oilseeds (0.55%), millets (0.43%) and cereals (0.40%). The emission increased with increasing rate of N application (r2 = 0.74, P < 0.05). The cumulative flux of CH4 from the rice crop was 28.64 ± 4.40 kg haâ 1, while the mean seasonal integrated flux of CO2 from soils ranged from 3058 ± 236 to 3616 ± 157 kg CO2 haâ 1 under different crops. The global warming potential (GWP) of crops varied between 3053 kg CO2 eq. haâ 1 (pigeon pea) and 3968 kg CO2 eq. haâ 1 (wheat). The carbon equivalent emission (CEE) was least in pigeon pea (833 kg C haâ 1) and largest in wheat (1042 kg C haâ 1). The GWP per unit of economic yield was the highest in pulses and the lowest in cereal crops. The uncertainties in emission values varied from 4.6 to 22.0%. These emission values will be useful in updating the GHGs emission inventory of Indian agriculture.
81
Journal: Science of The Total Environment - Volume 542, Part A, 15 January 2016, Pages 551-561
