| کد مقاله | کد نشریه | سال انتشار | مقاله انگلیسی | نسخه تمام متن |
|---|---|---|---|---|
| 4909145 | 1427101 | 2017 | 11 صفحه PDF | دانلود رایگان |
عنوان انگلیسی مقاله ISI
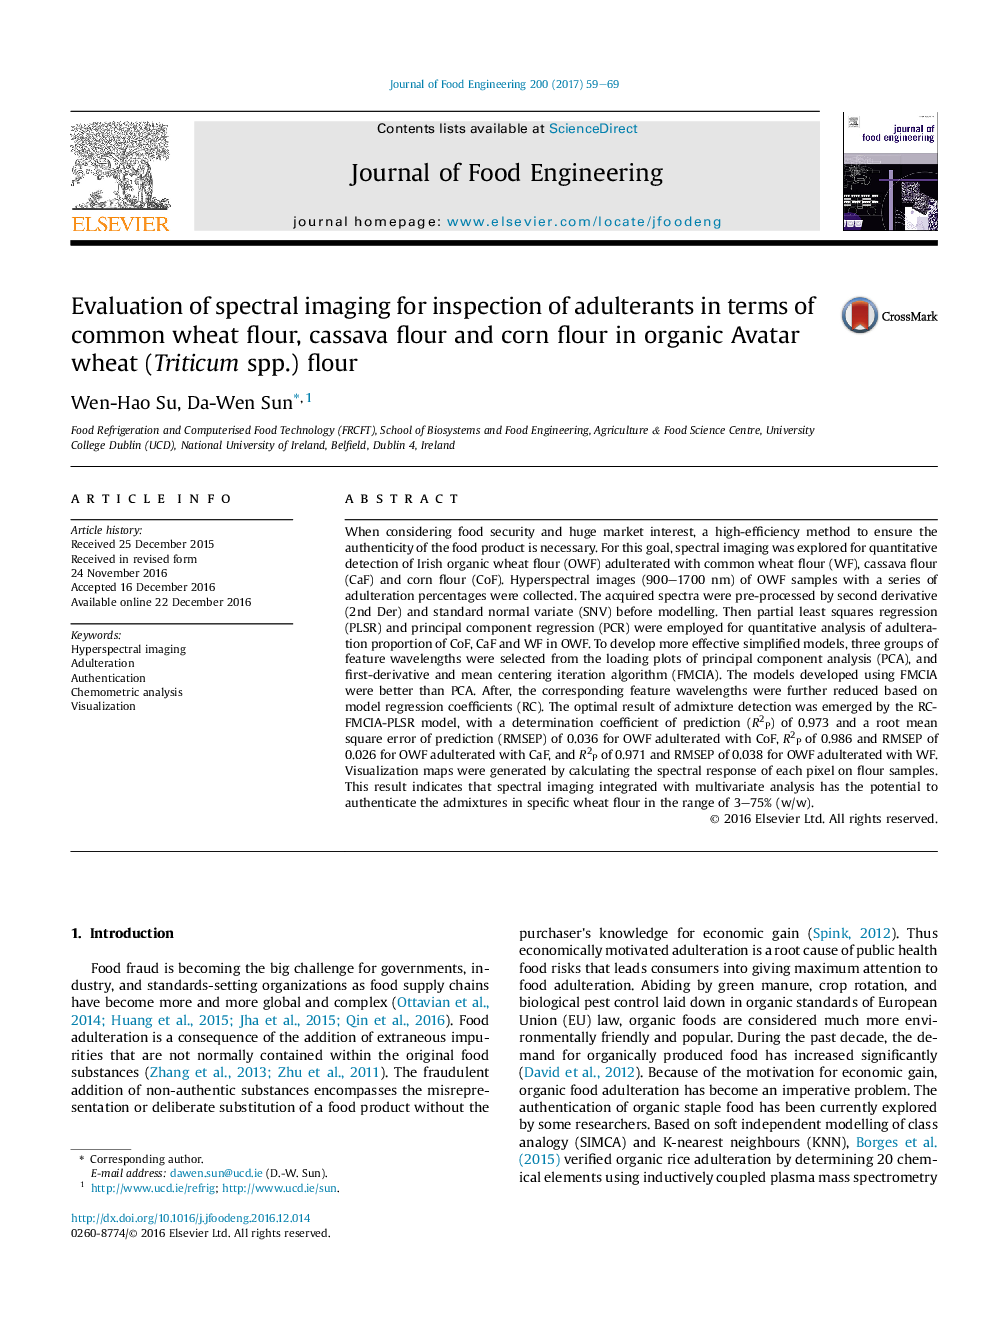
Evaluation of spectral imaging for inspection of adulterants in terms of common wheat flour, cassava flour and corn flour in organic Avatar wheat (Triticum spp.) flour
دانلود مقاله + سفارش ترجمه
دانلود مقاله ISI انگلیسی
رایگان برای ایرانیان
کلمات کلیدی
موضوعات مرتبط
مهندسی و علوم پایه
مهندسی شیمی
مهندسی شیمی (عمومی)
پیش نمایش صفحه اول مقاله

چکیده انگلیسی
When considering food security and huge market interest, a high-efficiency method to ensure the authenticity of the food product is necessary. For this goal, spectral imaging was explored for quantitative detection of Irish organic wheat flour (OWF) adulterated with common wheat flour (WF), cassava flour (CaF) and corn flour (CoF). Hyperspectral images (900-1700Â nm) of OWF samples with a series of adulteration percentages were collected. The acquired spectra were pre-processed by second derivative (2nd Der) and standard normal variate (SNV) before modelling. Then partial least squares regression (PLSR) and principal component regression (PCR) were employed for quantitative analysis of adulteration proportion of CoF, CaF and WF in OWF. To develop more effective simplified models, three groups of feature wavelengths were selected from the loading plots of principal component analysis (PCA), and first-derivative and mean centering iteration algorithm (FMCIA). The models developed using FMCIA were better than PCA. After, the corresponding feature wavelengths were further reduced based on model regression coefficients (RC). The optimal result of admixture detection was emerged by the RC-FMCIA-PLSR model, with a determination coefficient of prediction (R2P) of 0.973 and a root mean square error of prediction (RMSEP) of 0.036 for OWF adulterated with CoF, R2P of 0.986 and RMSEP of 0.026 for OWF adulterated with CaF, and R2P of 0.971 and RMSEP of 0.038 for OWF adulterated with WF. Visualization maps were generated by calculating the spectral response of each pixel on flour samples. This result indicates that spectral imaging integrated with multivariate analysis has the potential to authenticate the admixtures in specific wheat flour in the range of 3-75% (w/w).
ناشر
Database: Elsevier - ScienceDirect (ساینس دایرکت)
Journal: Journal of Food Engineering - Volume 200, May 2017, Pages 59-69
Journal: Journal of Food Engineering - Volume 200, May 2017, Pages 59-69
نویسندگان
Wen-Hao Su, Da-Wen Sun,